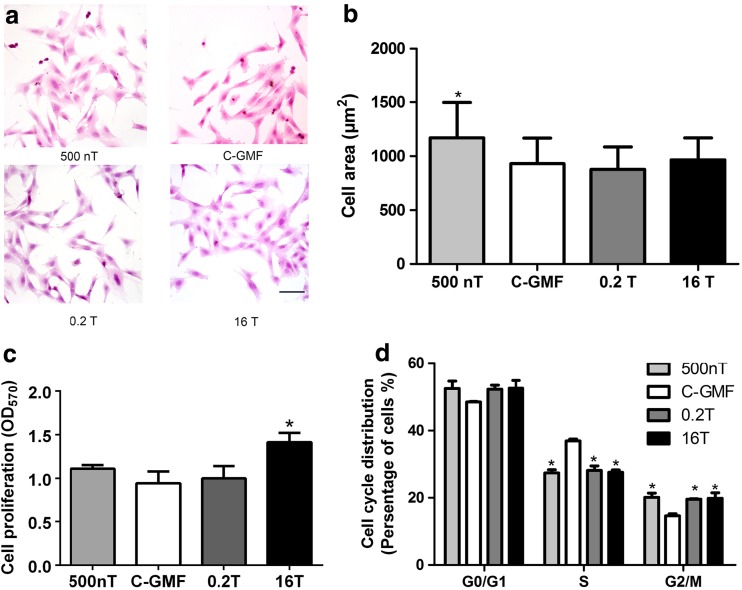
Fig. 2.
The cell growth of MC3T3-E1 cells under SMFs. a Cell morphology was measured by HE staining. Bar, 100 μm. b Cell area was analyzed by Image J software (n = 100). c The proliferation of MC3T3-E1 cells was examined by MTT assay, and the results were shown as optical density at 570 nm (OD570) (n = 3). d The cell cycle distribution of MC3T3-E1 cells under SMFs. MC3T3-E1 cells were synchronized at G0/G1-phase by serum starvation and then released under varied SMFs for 1 d. Cell cycle distruibution was determined by flow cytometry with PI staining (n = 3). All SMF groups were compared with the GMF of 0.05 mT group. Data shown are mean ± SD, *P < 0.05

