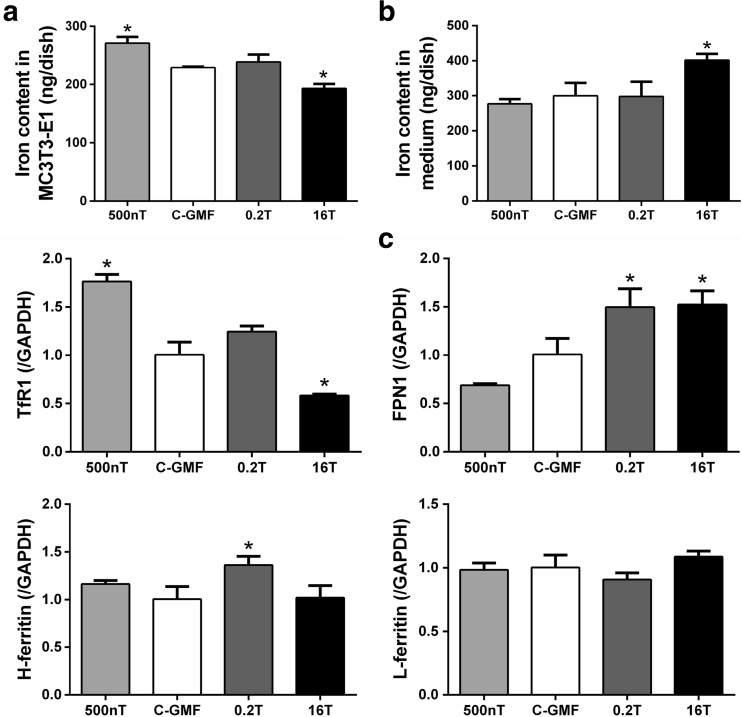
Fig. 7.
Effects of SMFs on iron metabolism of osteoblasts during differentiation. Iron content in cells was detected by graphite furnace AAS (a), and in culture medium was detected by flame AAS (b), and expressed as milligram per dish. mRNA expressions of iron metabolism markers in cells were measured by Q-RT-PCR 2 days after SMFs treatment (c). All SMF groups were compared with the GMF of 0.05 mT group. Data shown are mean ± SD, *P < 0.05

