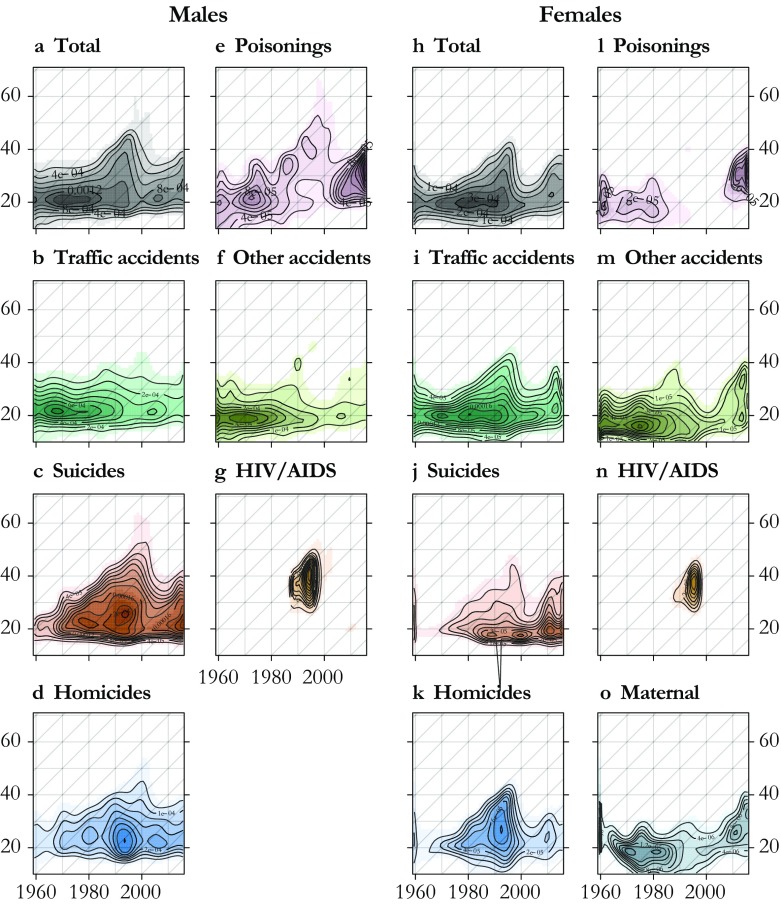
Fig. 7.
Lexis surfaces of cause-specific contributions to the hump, U.S. males and females 1959–2015. These correspond to the computed for each year. Each cause is plotted on a dedicated color scale (visible in the online version of the article), and contours are superimposed to give an indication of the magnitude

