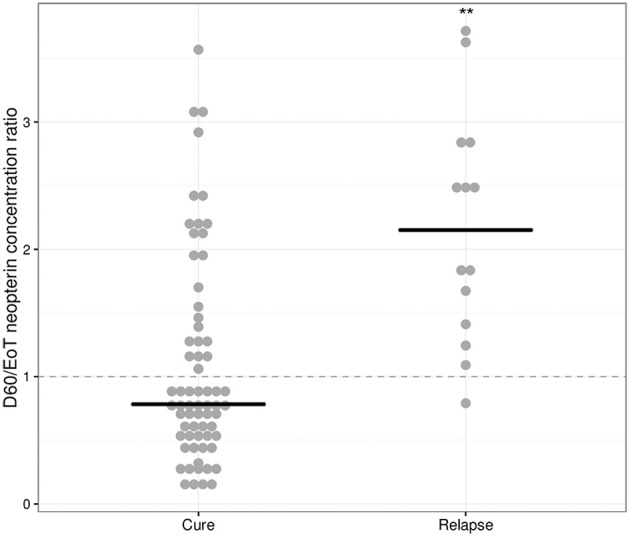
Figure 4.

D60/EoT neopterin concentration ratio for cured and relapsed patients. D60/EoT neopterin concentration ratio, for cured patients (n = 66) and patients that relapsed after treatment (n = 14). The dashed line indicates no difference within 1 month after end of treatment (combination therapy: day 11, monotherapy: day 28). Dots indicate individual observations, the horizontal lines the median per group. **p < 0.001, Welch t-test on log-transformed data.
