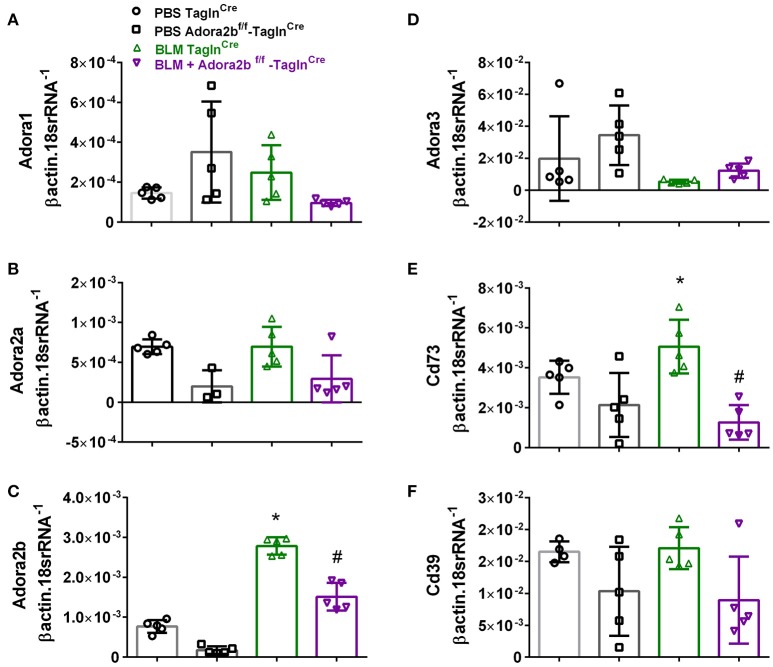
Figure 4.
Expression levels of adenosine receptors and genes associated with adenosine synthesis in TaglnCre and Adora2bf/f−TaglnCre mice exposed to bleomycin (BLM) or vehicle phosphate-buffered saline (PBS). All analyses were performed on day 33 of PBS or BLM exposure. Adora1 (A); Adora2a (B); Adora2b (C); Adora3 (D); Cd73 (E); Cd39 (F); expression levels measured by RT-PCR and normalized to the Geo mean of expression levels of βactin and 18srRNA from PBS-TaglnCre mice (black circles and bar outline); PBS- Adora2bf/f−TaglnCre mice (black squares and bar outline); BLM-TaglnCre mice (green triangles and bar outline); BLM-Adora2bf/f−TaglnCre mice (magenta triangles and bar outline). Significant values: *P < 0.05 refer to comparisons between TaglnCre BLM and TaglnCre PBS treatment groups. #P < 0.05, are for comparisons between TaglnCre BLM and Adora2bf/f-TaglnCre + BLM treatment groups. N = 5 for all groups.

