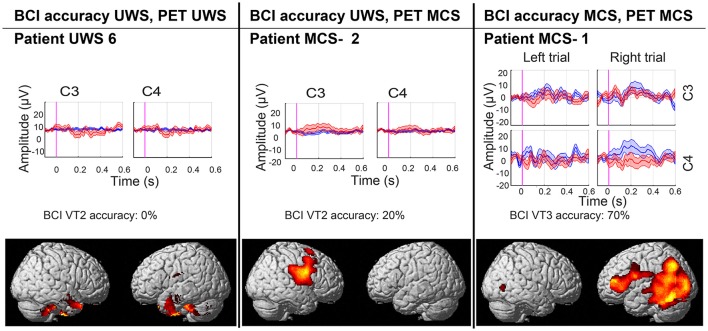
Figure 2.
BCI performance and areas of preserved (in red-yellow) cerebral glucose metabolism compared to healthy subjects (significant at <0.001 uncorrected). Results are presented for a representative UWS (left) and MCS (middle) patient without covert response to command, and for the patient with covert response to command (right). In the ERP plot blue lines represent the P3 for the attended hand, and red line represent the P3 for the unattended hand.

