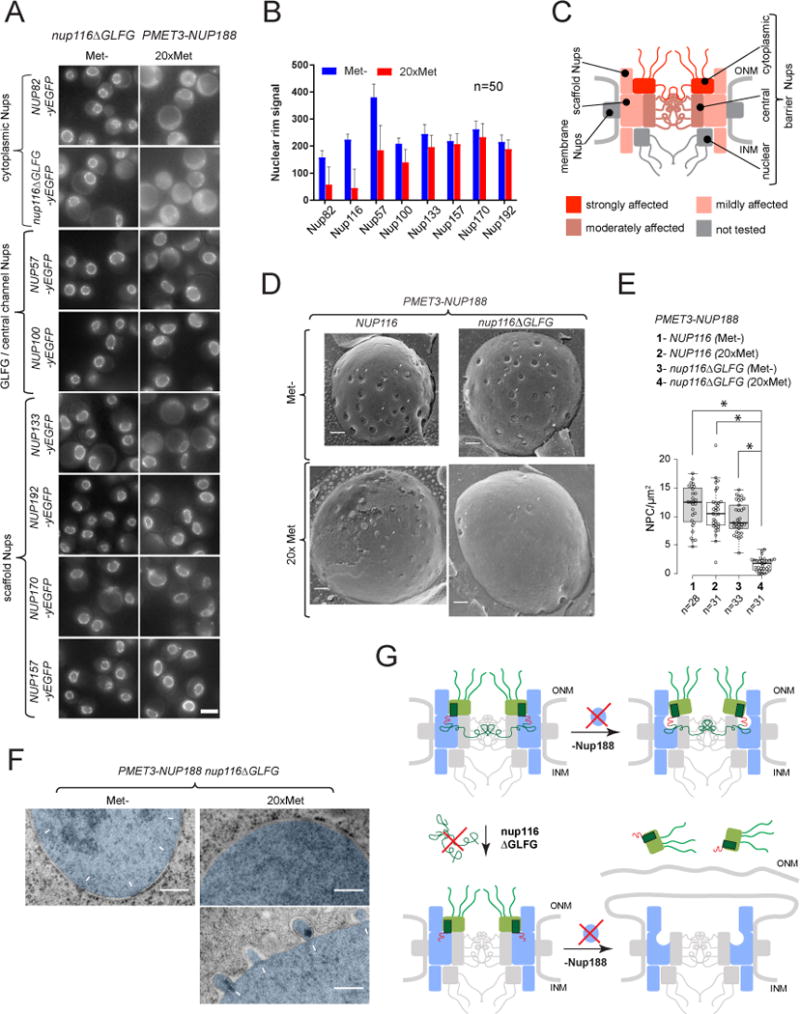
Figure 5. GLFG-repeats of Nup116 are critical for NPC biogenesis in the absence of Nup188. See also Figures S5, S6.

(A) Fluorescence images illustrating localization of GFP-tagged Nups in PMET3-NUP188 nup116ΔGLFG cells after 12h incubation in Met- or 20×Met media. Scale bar – 5 μm.
(B) DsRed-HDEL-based quantification of Nup-GFP signal intensities at the nuclear rim. Mean +/− SD; (n) - number of analyzed image frames per condition.
(C) Graphical summary of Nup mislocalization effects shown in (A and B).
(D) Freeze-fracture SEM images illustrating the NPC morphology at the NE (arrowheads) in PMET3-NUP188 cells expressing either the wild-type or ΔGLFG variant of Nup116, incubated for 12h in Met- or 20× Met media.
(E) Box-plot summarizing densities of NPC structures quantified for the experiments in (C). (n) - number of examined NE fractures. Levels - median values; boxes -interquartile ranges; error bars - upper and lower whiskers; Asterisks (*) – significant differences, Mann-Whitney p-values (< 0.0001).
(F) TEM images of cells treated as described in (D). The nuclear regions (nuc) are pseudo-colored in blue, white arrows – intact NPCs and NE herniations. (G) Model describing the development of NPC defects observed upon deletion of Nup116 GLFG-repeats and depletion of Nup188.
