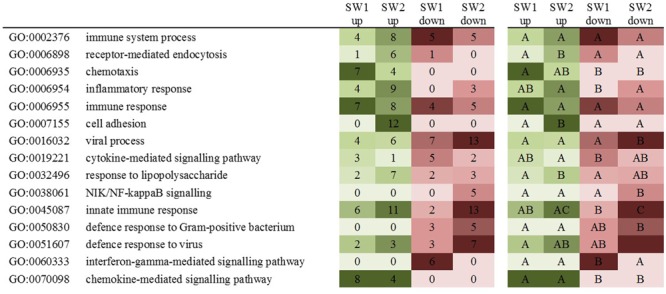
FIGURE 2.

Heat map of the 15 main biological processes indicating the differences between diet comparisons. Shown are GO terms and descriptions; seaweed (SW) diets 1 and 2 scores of up- and down-regulated genes. Also indicated the significant differences (P < 0.05).
