
Figure 4.
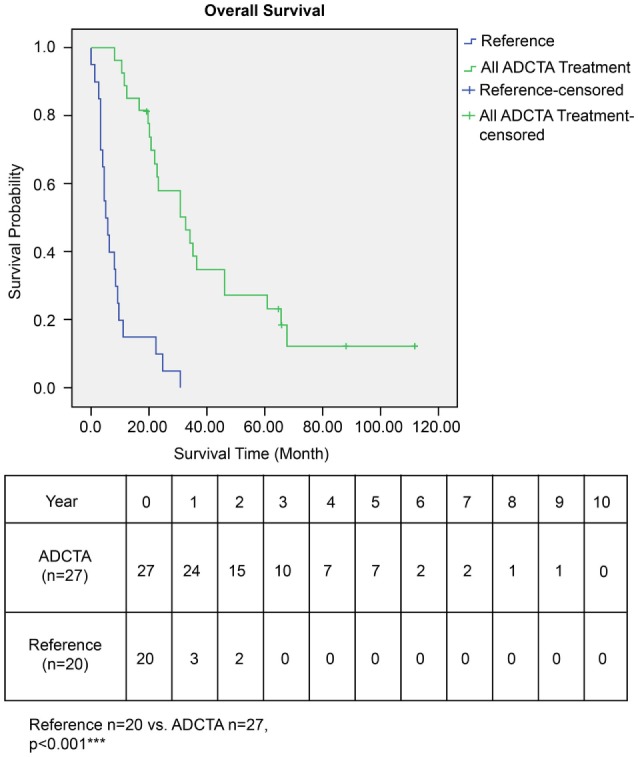
Overall survival (OS) in ADCTA versus reference group glioblastoma patients. Kaplan–Meier survival plots of the OS of 27 ADCTA patients compared to 20 reference patients.
Official websites use .gov
A
.gov website belongs to an official
government organization in the United States.
Secure .gov websites use HTTPS
A lock (
) or https:// means you've safely
connected to the .gov website. Share sensitive
information only on official, secure websites.
Overall survival (OS) in ADCTA versus reference group glioblastoma patients. Kaplan–Meier survival plots of the OS of 27 ADCTA patients compared to 20 reference patients.