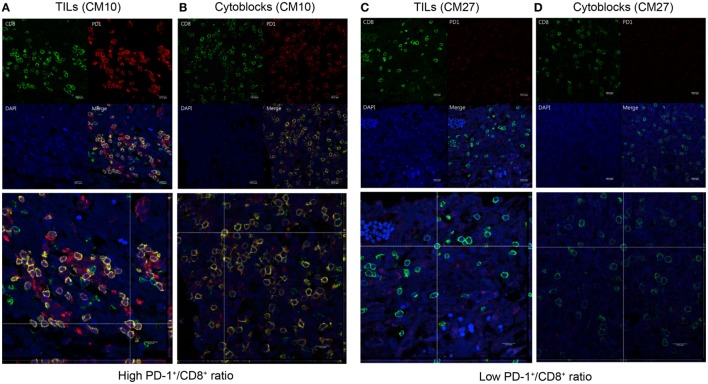
Figure 9.
Co-expression of programed death 1 (PD-1) and CD8 in PD-1-positive and CD8-positive tumor-infiltrating lymphocytes and peripheral blood mononuclear cells (PBMCs). Paired GBM tissue sections and PBMC cytoblocks from a representative patient with a high PD-1+/CD8+ ratio were selected for immunofluorescence (IF) analysis of PD-1 and CD8 co-expression. CD8 and PD-1 expression in the TIL of GBM tissue [(A), upper panel] and reconstruction of single slices of the xz and the yz planes in the z-axis stacked image [(A), lower panel]. CD8 and PD-1 expression in PBMCs derived from the same patient [(B), upper panel] and reconstruction of the same immunofluorescent slide [(B), lower panel]. Paired GBM tissue sections and PBMC cytoblocks from a representative patient with a low PD-1+/CD8+ ratio were selected for IF analysis of PD-1 and CD8 co-expression. CD8 and PD-1 expression in the TIL of GBM tissue [(C), upper panel] and reconstruction of single slices of the xz and yz planes in the z-axis stacked image [(C), lower panel]. CD8 and PD-1 expression in PBMCs derived from the same patient [(D), upper panel] and reconstruction of the same immunofluorescent slide [(D), lower panel].

