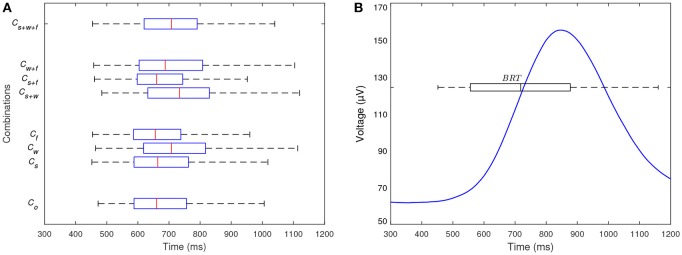
Figure 5.
(A) Distributions of BRT across all participants for each experimental combination. At least one of the distributions is significantly different which indicates different BRT across the experimental combinations. (B) Time-resolved LEG signal averaged across all participants for all experimental combination. The distribution of BRT across all participants and experimental combination is also shown. The reference time t = 0 correspond to the stimulus. The LEG signal begins to increase at ~600 ms (i.e., prior to the median BRT) and peaks at ~850 ms.

