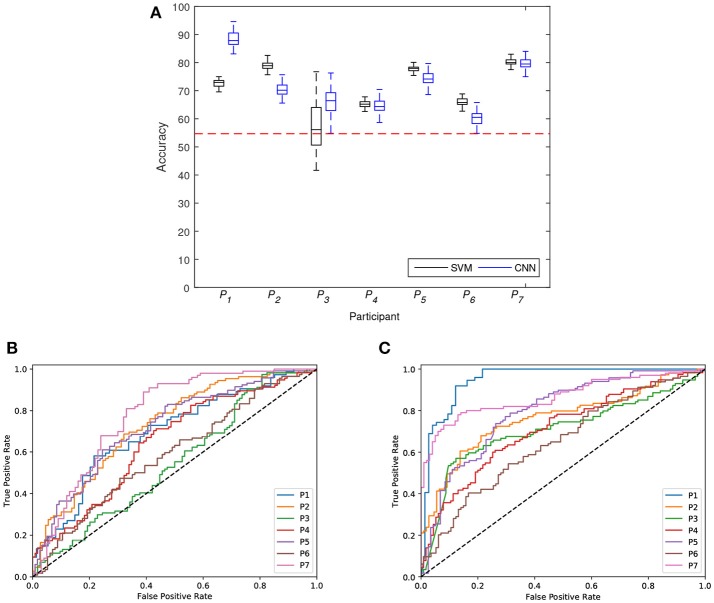
Figure 6.
(A) Distribution of classification accuracy achieved with SVM and CNN for each participant (P1 to P7). The horizontal dotted red line represents the significant chance level or accuracychance. (B) ROC curves for SVM classifiers for each participant. (C) ROC curves for CNN classifiers for each participant. The diagonal dotted black line represents the threshold AUC = 0.5.

