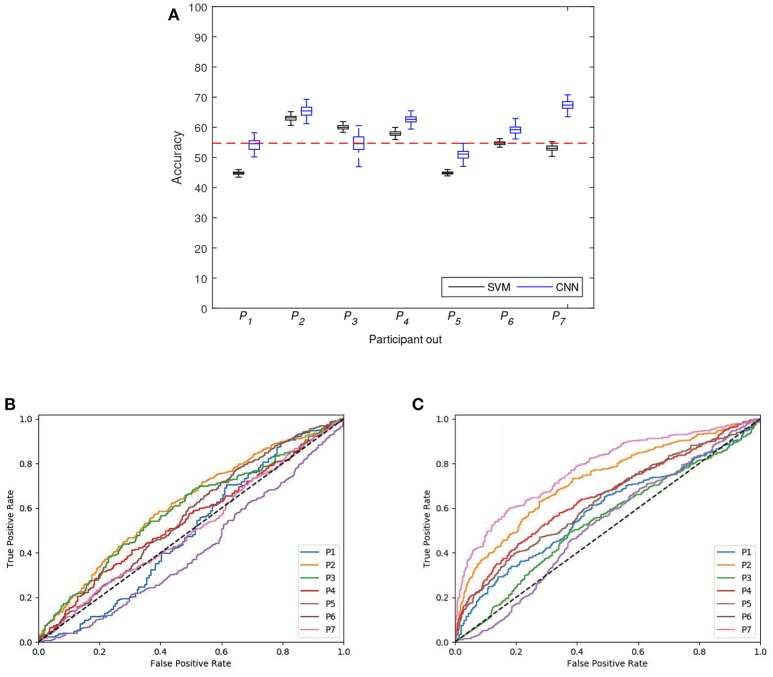
Figure 7.
(A) Distribution of classification accuracy achieved with SVM and CNN for the classification experiment leave-one-out participant. The horizontal dotted red line represents the significant chance level or accuracychance. (B) ROC curves for SVM classifiers for each leave-one-out participant. (C) ROC curves for CNN classifiers for leave-one-out participant.

