
Figure 2.
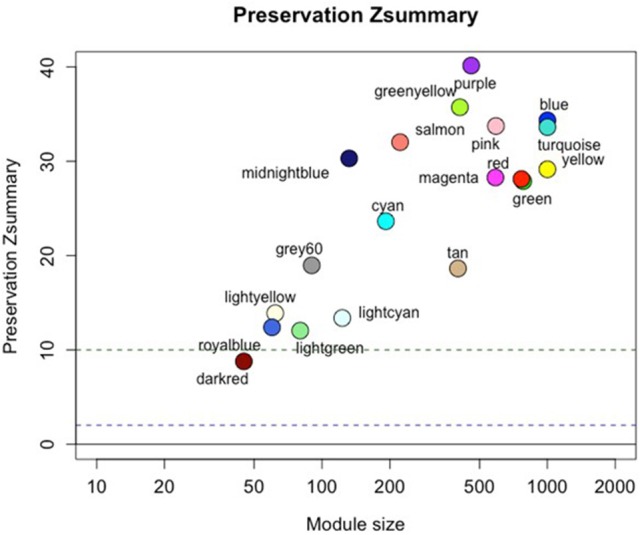
Progressor network modules are preserved in the non-progressor network. Figure shows preservation Zsummary statistic (y-axis) as a function of module size. The dashed blue (low) and green (high) lines are thresholds highlighting 2 < Z < 10 region corresponding to moderate/high preservation. Detailed statistics of all modules are listed in the Supplementary Data-1.