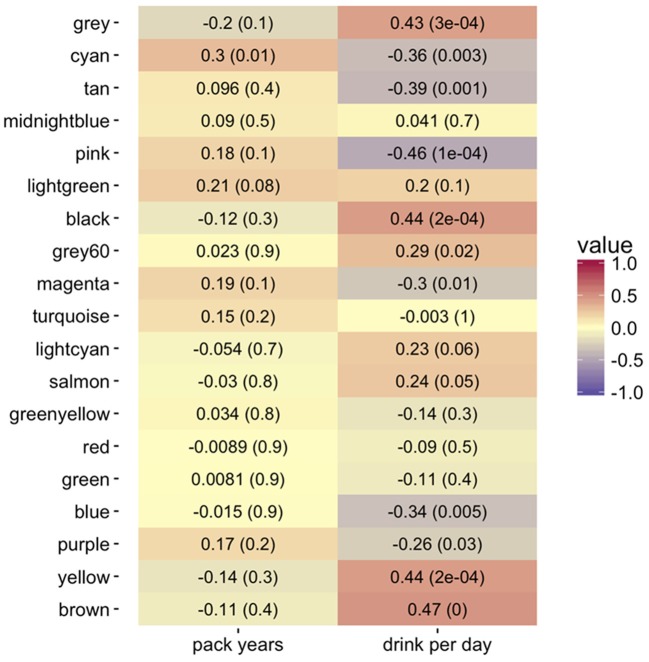
Figure 4.
Heatmap of Pearson correlations (−1:1 shown by color legend) for alcohol (drinks per day) and tobacco use (pack years) with the co-expression consensus module progressor eigengenes. The corresponding p-values are in parentheses. The brown, yellow, black, pink, tan, and cyan modules show the highest positive correlation with drinks per day. The cyan module shows the highest positive correlation with tobacco pack years smoked.

