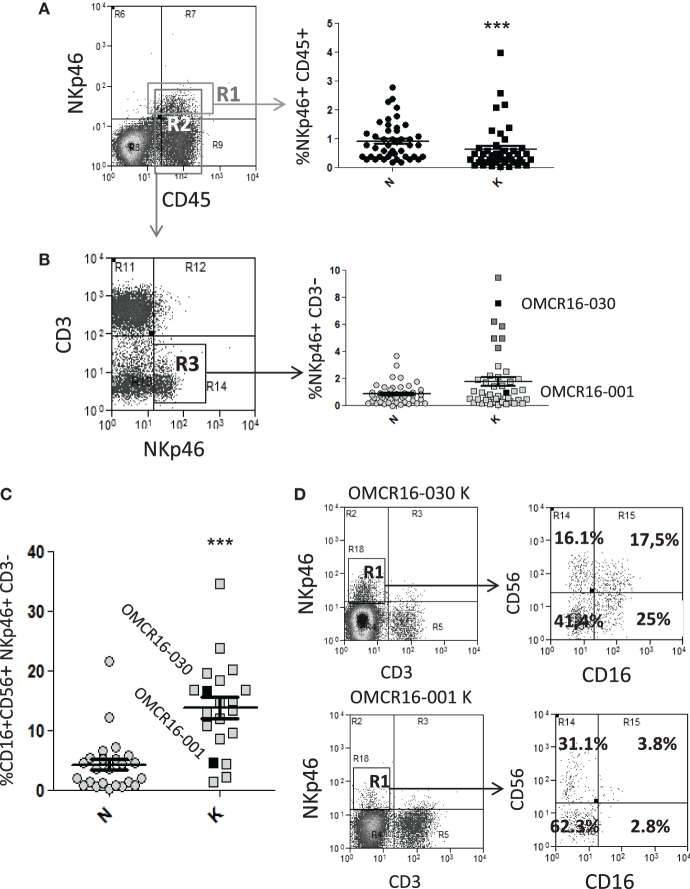
Figure 5.
CRC cell suspensions contain infiltrating NKp46+ CD16+ natural killer (NK) cells. (A,B) CRC cell suspensions obtained from the tumor (K) or the non-tumor (N) areas of 45 specimens were stained with the anti-CD45 T205, the anti-CD3 JT3A, followed by FITC-anti IgM and APC-anti-IgG2a goat anti-mouse antiserum and PE-anti-NKp46 monoclonal antibodies (mAbs), and analyzed by FACS. Panel (A), left: dot plot of immunofluorescence of a representative case of CRC. R1: gate on NKp46+CD45+cells, R2: gate on CD45+ cells. Panel (A), right: percentage of NKp46+CD45+ cells in gate as R1 in 45 CRC. ***p < 0.001, non-parametric two-tailed t test Mann–Whitney. Panel (B), left: dot plot of immunofluorescence on gate R2 of the sample depicted in panel (A). R3: gate on NKp46+CD3− cells. Panel (B), right: percentage of NKp46+CD3− cells in gate R3 in 45 CRC. The two cases indicated with black squares (OMCR16-030, above the mean and OMCR16-001, below the mean) are shown in more detail in panel (D). Dark gray squares indicate the six cases, besides OMCR16-030, with NKp46+CD3− cells between 4 and 10%, (C) CRC cell suspensions obtained from the tumor (K) or the non-tumor (N) areas of 20 specimens were stained with the PE/Dazzle-anti-CD3, PE-Cy7-anti-NKp46, PE-Cy5-anti-CD56, and Pacific Blue-anti-CD16 mAbs. CD56+CD16+ cells among the NKp46+CD3− cell population. ***p < 0.001, non parametric two-tailed t test Mann–Whitney. Black squares: OMCR16-030 and OMCR16-001. (D) CD56 and CD16 expression (right dot plots) on the NKp46+CD3− tumor cell population (K, gated in R1, left dot plots) of the two cases indicated with black squares in panels (B,C) (OMCR16-030 and OMCR16-001). In each quadrant: percentage of positive cells.

