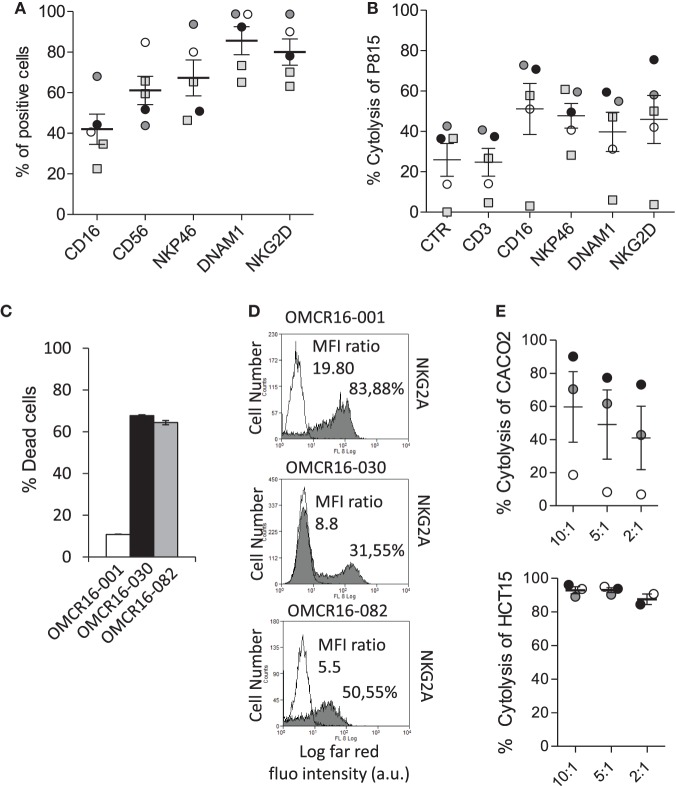
Figure 6.
Sorted NKp46+ CD3− cells from CRC give rise to natural killer (NK) cells with anti-tumor-associated fibroblasts (TAF) and antitumor activity. (A) Phenotype of cell suspensions from five CRC, by immunofluorescence with monoclonal antibodies (mAbs) against the indicated molecules (CD16, CD56, NKp46, DNAM1, and NKG2D) followed by anti-isotype APC-goat anti-mouse (GAM) antiserum and FACS analysis. Results are expressed as percentage of positive cells. Mean ± SEM of the five cases is shown. (B) Sorted NKp46+ CD3− cells of 5 CRC, expanded with IL-2, were assayed in redirected killing (ATCC) against P815, in a 51Cr release assay, using mAbs recognizing CD16, NKp46, DNAM1, and NKG2D (CD3 was used as negative control). Results are expressed as percentage of P815 cell lysis. Mean ± SEM of the five cases is shown. (C) NKp46+ CD3− cell populations from three CRC [OMCR16-030, OMCR16-082, and OMCR16-001, black, gray, and white, respectively, as the circles in panels (A,B)] were co-cultured for 24 h with autologous TAF at the ratio of 10:1 (NKp46+CD3−/TAF); then TAF viability was assessed by crystal violet assay and results expressed as percentage of dead cells. Mean ± SEM of triplicate samples is shown. (D) Expression of NKG2A by indirect immunofluorescence with the specific mAb (gray histograms), followed by isotype-specific APC-GAM and FACS analysis, on OMCR16-001, OMCR16-030, and OMCR16-082 NKp46+CD3− cells. White histograms: negative control with APC-GAM alone. Results are expressed as log far-red fluorescence intensity (a.u.) vs number of cells. In each quadrant: percentage of positive cells and MFI ratio (MFI gray/MFI white histograms, a.u.). (E) Cytolytic activity of NKp46+CD3− cell populations from OMCR16-030, OMCR16-082, and OMCR16-001 (black, gray, and white circles, respectively) against the HLA-I+ Caco2 (upper graph) or the HLA-I− HCT15 (lower graph) CRC cell lines, in a 51Cr release assay. Results are expressed as percentage of specific cytolysis. Mean ± SEM of the three cases is shown.

