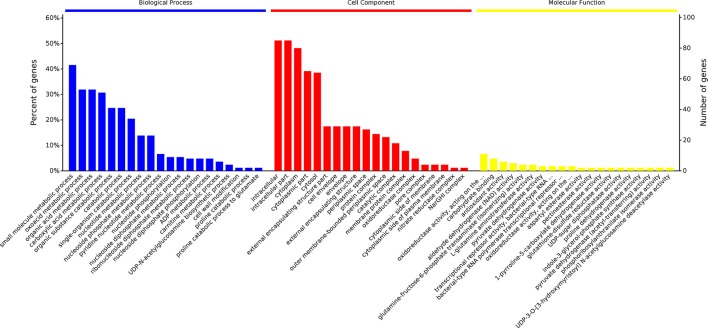
Figure 4.
Percent of genes of GO functional annotation results: Biological Process (BP); Cellular Component (CC), and Molecular Function (MF). For each GO ontology, significance of each gene decreases from left to right (P < 0.05). The differential proteins identified were screened and classified according to the online database David 6.7 (http://david.abcc.ncifcrf.gov/) and QuickGO (http://www.ebi.ac.uk/QuickGO/), three GO categories, including Biological Process, Cellular Component, and Molecular Function, were enriched. Percent of genes of GO functional annotation results were performed using Microsoft Excel 2007.

