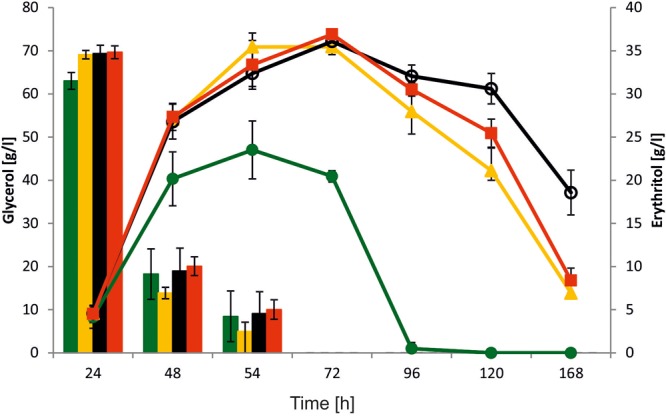
FIGURE 5.

Shake-flask experiment with various Y. lipolytica strains: A101 (green), AJDD pAD-EYI1 (yellow), AJDD ΔEYI1 (black), and AJDD c-EYI1 (red). 100 g/L glycerol assimilation (bars) and erythritol production/assimilation (lines). The cultures were performed in three biological replicates. Error bars represent standard deviation.
