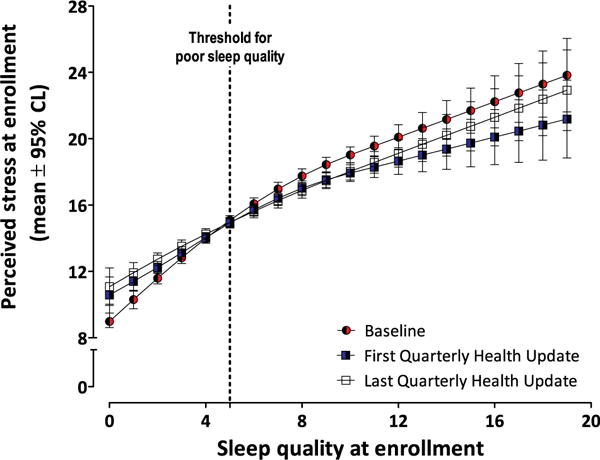
Figure 2.

The positive association between poor sleep quality (higher X-axis scores on the PSQI) and perceived stress persisted throughout follow-up. Values on the Y axis are mean (95% confidence limits) PSS scores. The 3 plotted series are data from baseline, at first Quarterly Health Update, and final Quarterly Health Update. The dotted vertical line at the value “5” on the X axis indicates the threshold for poor sleep quality.
