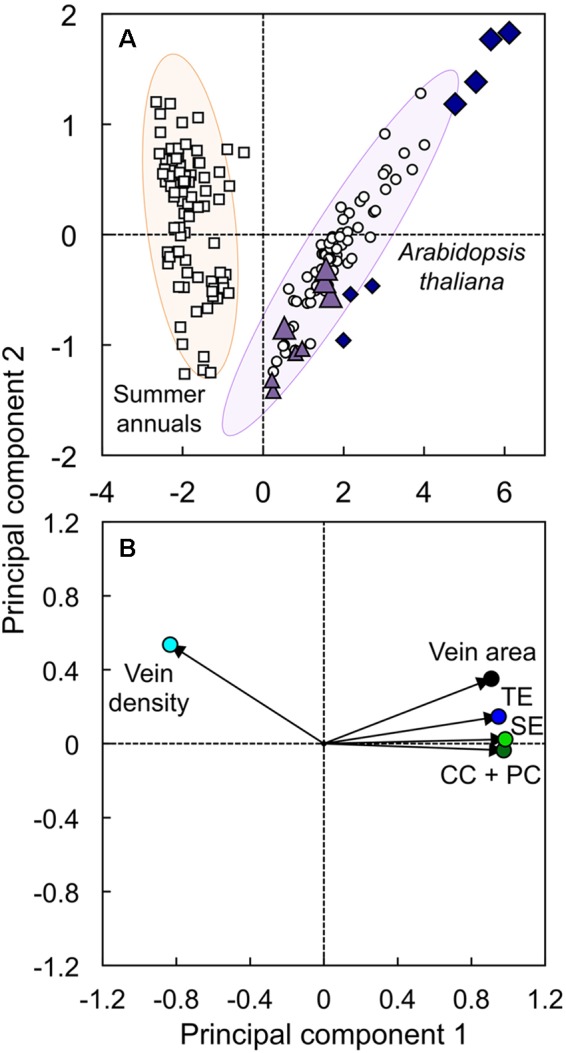
FIGURE 10.

The (A) score and (B) loading plots from a principal component analysis of foliar vein density (light blue circle), minor vein cross-sectional area (black circle), and number of tracheary elements (TE; dark blue circle), sieve elements (SE; green circle), and companion cells plus phloem parenchyma cells (CC + PC; dark green circle) per minor vein in leaves of the Col-0 (violet triangles) and low-vein-density Ei-5 (indigo diamonds) accessions of A. thaliana grown under a 9-h photoperiod of 100 (small triangles and diamonds) or 1000 (large triangles and diamonds) μmol photons m-2 s-1 at a leaf temperature of 20°C, as well as leaves of Col-0, Italian and Swedish ecotypes of A. thaliana (open circles; n = 67), and summer annual crop species (open squares; n = 83) grown under multiple experimental conditions. Principal component 1 explained 86.7% of the variation in the data, and principal component 2 explained 8.64% of the variation in the data. Density ellipses (P = 0.950) of the summer-annual (orange ellipse) and A. thaliana (purple ellipse) groups have been superimposed behind the score plot. Data for A. thaliana from Cohu et al. (2013a,b), Adams et al. (2016), and Stewart et al. (2017a,b), and data for summer annuals from Cohu et al. (2014); Muller et al. (2014b), and Polutchko et al. (2018)
