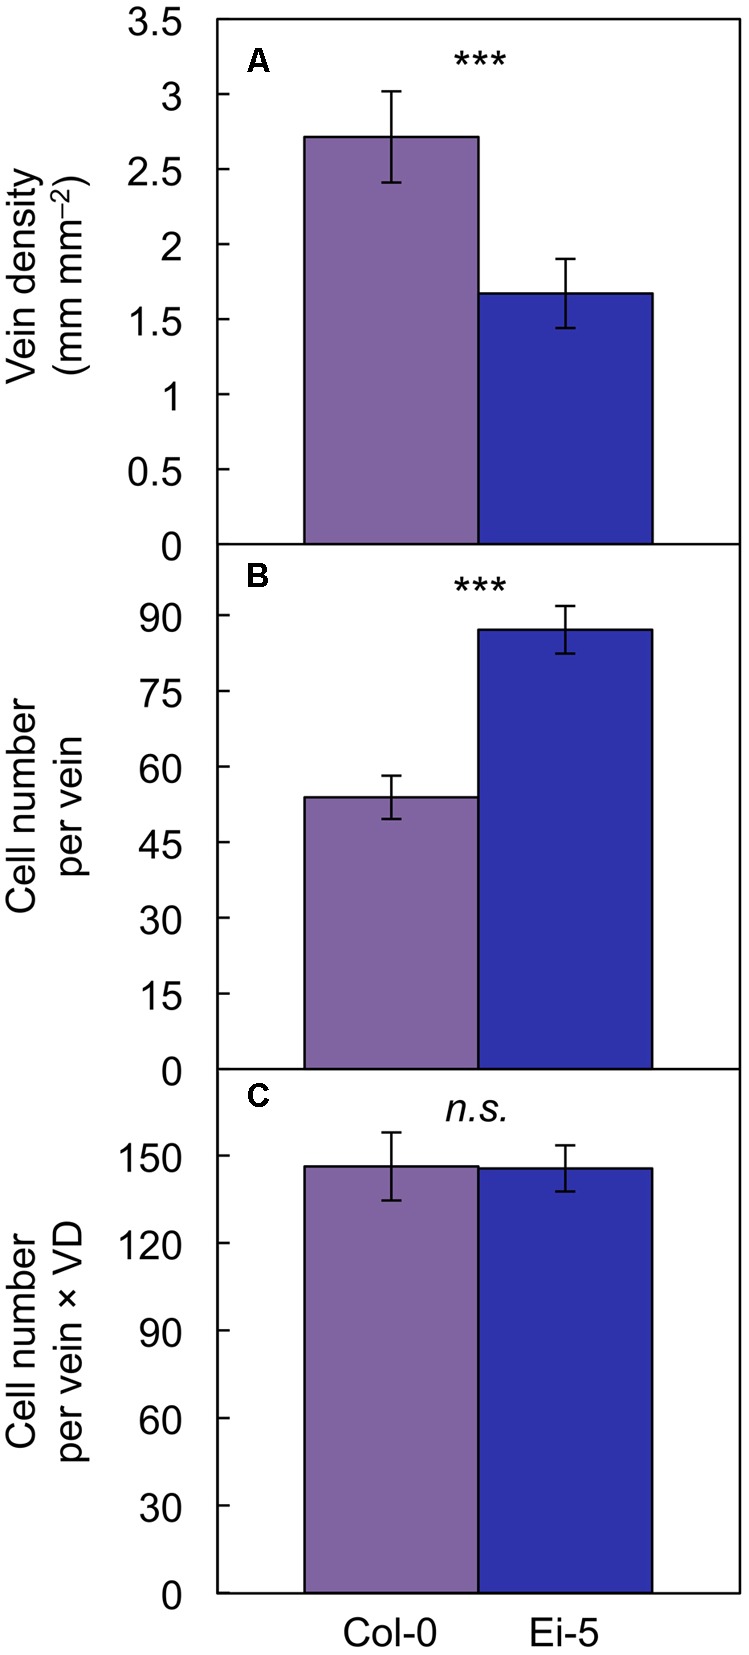
FIGURE 5.

The (A) foliar vein density, (B) number of cells per minor vein, and (C) product of vein density and the number of cells per minor vein in the Col-0 (violet columns) and low-vein-density Ei-5 (indigo columns) accessions of A. thaliana grown under a 9-h photoperiod of 1000 μmol photons m-2 s-1 at a leaf temperature of 20°C. Mean values ± standard deviation for (A) and ±standard error for (B,C); n = 4. The asterisks denote significant differences between the mean values; ∗∗∗P < 0.001 and n.s., not significantly different.
