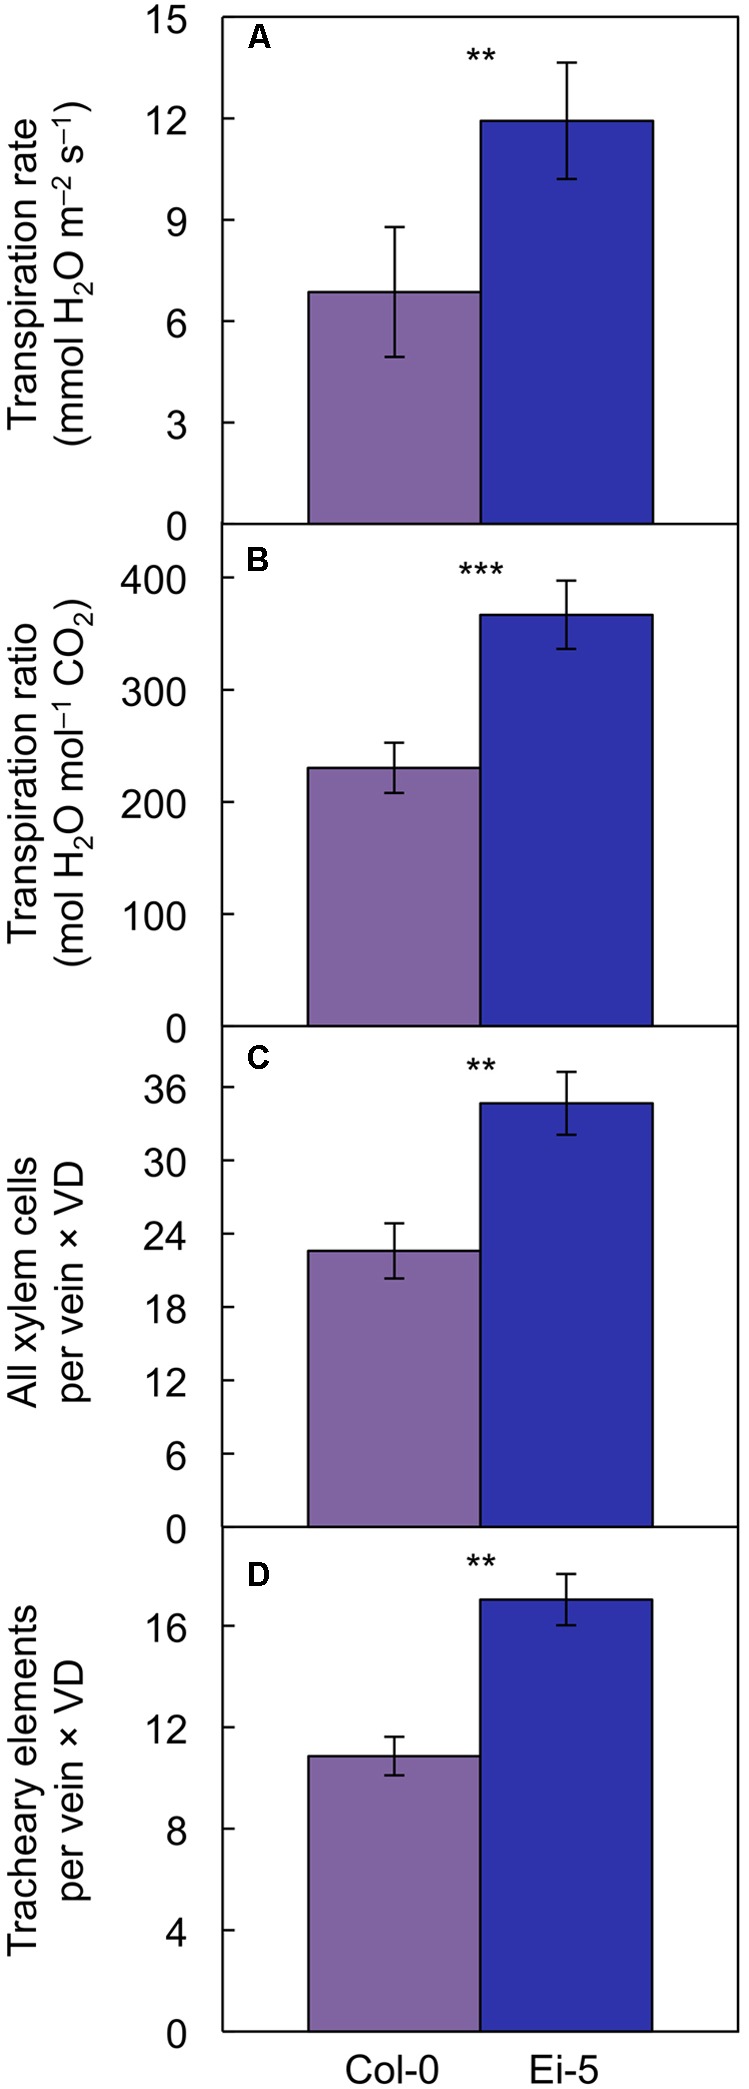
FIGURE 9.

The (A) rate of transpirational water loss, (B) ratio of transpirational water loss to CO2 uptake, (C) product of the number of xylem cells per minor vein and vein density, and (D) product of the number of tracheary elements per minor vein and vein density in leaves of the Col-0 (violet columns) and low-vein-density Ei-5 (indigo columns) accessions of A. thaliana grown under a 9-h photoperiod of 1000 μmol photons m-2 s-1 at a leaf temperature of 20°C. Mean values ± standard deviations for (A,B) and ± standard errors for (C,D); n = 4. The asterisks denote significant differences between the mean values; ∗∗P < 0.01, ∗∗∗P < 0.001.
