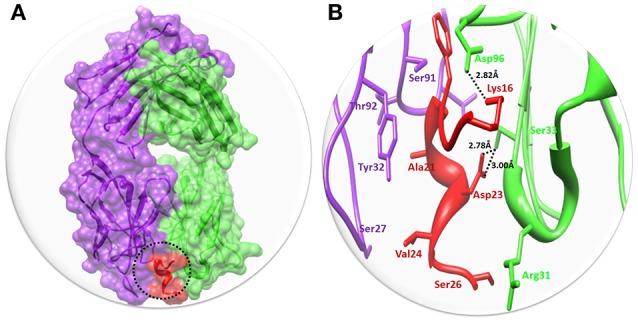
Figure 3.

The binding interaction of Solanezumab with Aβ. (A) The complex structure of Solanezumab with Aβ. The light chain is represented in purple color while heavy chain is highlighted in green color. Aβ is depicted in red color at Fab region of Solanezumab. The whole structure is represented in surface format. (B) The epitope region residues of Solanezumab of both light and heavy chain are represented in purple and green colors, respectively. The Aβ interacted residues are represented in red color while the black dotted lines are for bonding distance in angstrom (Å).
