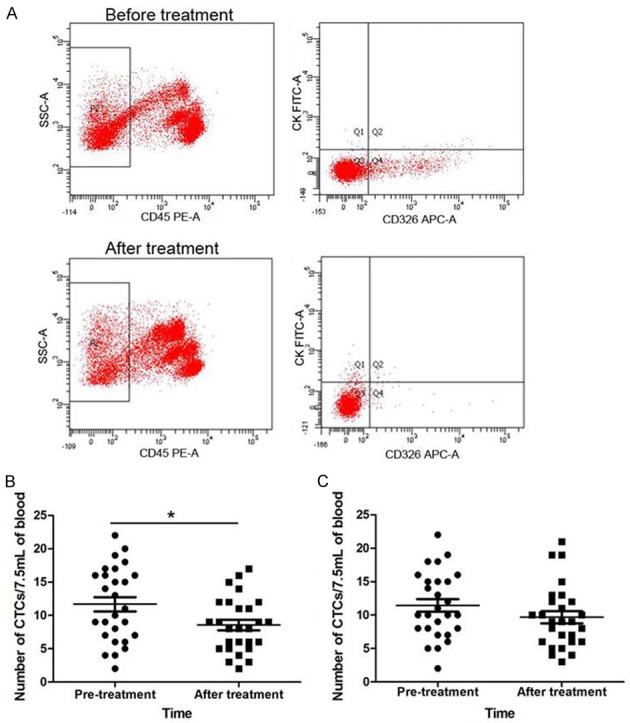
Figure 4.

Detection of the number of CTCs. A. CTC detection in one of the patients in group A. Before treatment, the CTCs number was 19/7.5 mL of blood. After treatment, the CTC number was 13/7.5 mL of blood. B. The number of CTCs in group A decreased significantly after treatment (P = 0.02). C. Change in CTC levels in group B was not significant (P = 0.18). *P < 0.05.
