
FIGURE 7.
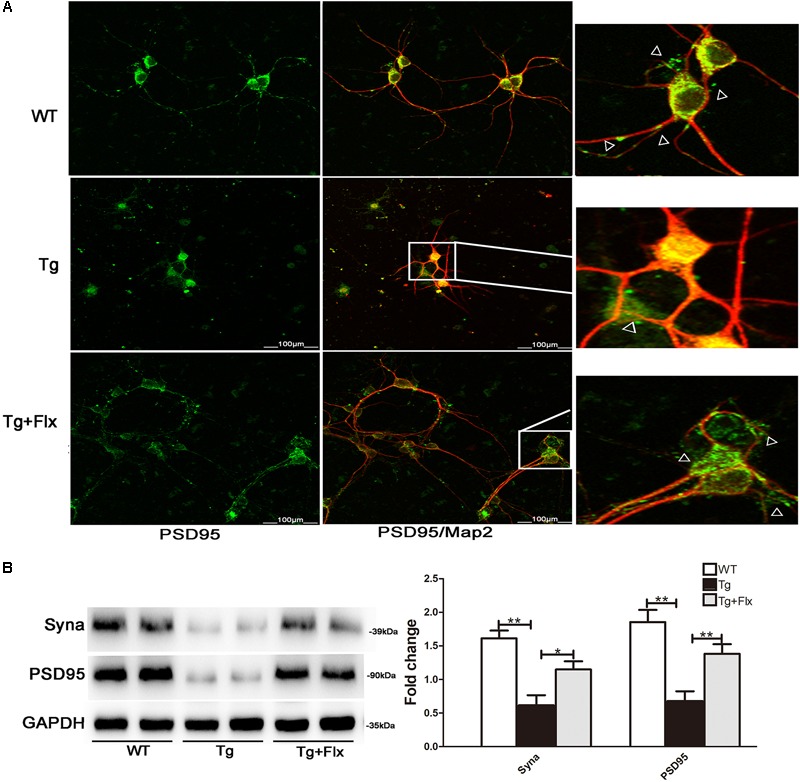
Fluoxetine protection of synapses in 3×Tg-AD neurons. (A) Double-labeling analysis results for neurons from WT mice, 3×Tg-AD, and fluoxetine-treated 3×Tg-AD mice. Neuronal marker MAP2 (red) with post synaptic density protein 95 (PSD95) (green). Scale bar = 100 μm. (B) The levels of Syna and PSD95 expression were analyzed via Western blot assay. WT, primarily cultured neurons of wild-type mice; Tg, primarily cultured neurons of 3×Tg-AD mice; Tg + FLX, primarily neurons of 3×Tg-AD mice treated with fluoxetine. Data were shown as mean ± SD, n = 12 animals/group. ∗p < 0.05, ∗∗p < 0.01.