Figure 5.

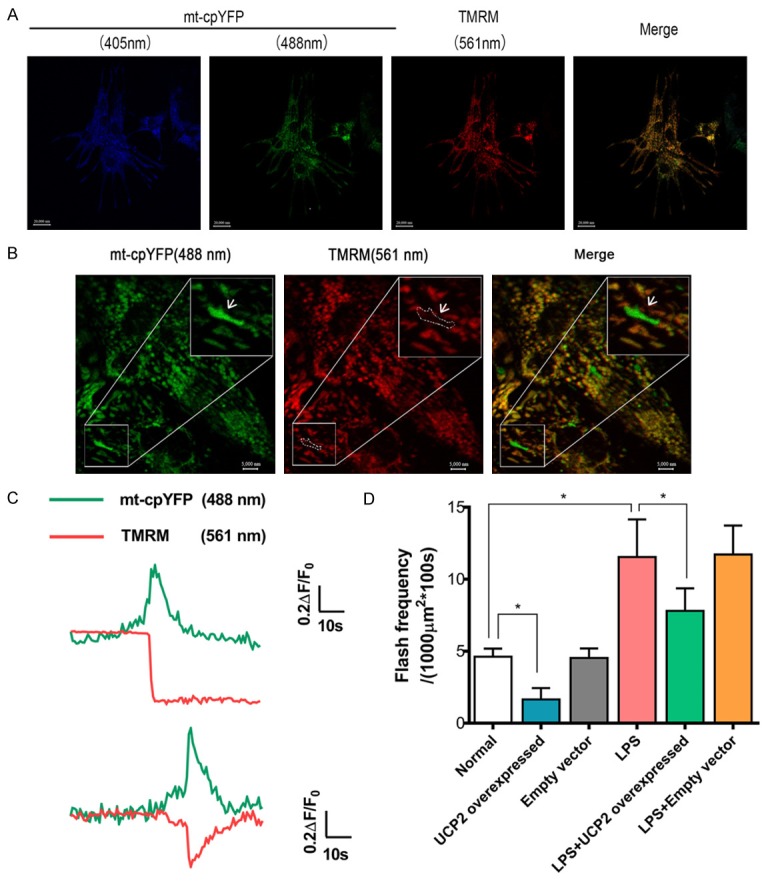
Single mitochondrial flashes detected in cardiomyocytes. (A) Representative images of the intact myocardium showing the colocalization of cpYFP and TMRM. Scale bar = 20000 nm. (B) Image of a single cardiomyocyte in the intact myocardium. The area highlighted by the white boxes is enlarged to show a mitochondrial flash accompanied with a decrease in the membrane potential (white arrows). Scale bars = 20000 and 5000 nm for the full size and enlarged images, respectively. (C) Traces showing the fluorescence changes during the single mitochondrial flash highlighted in (B). (D) Effects of UCP2 overexpression or LPS treatment (2 μg/ml, 24 h) on mitoflash activity in cardiomyocytes. 40/oil immersion field per group. N=6. *P<0.05.
