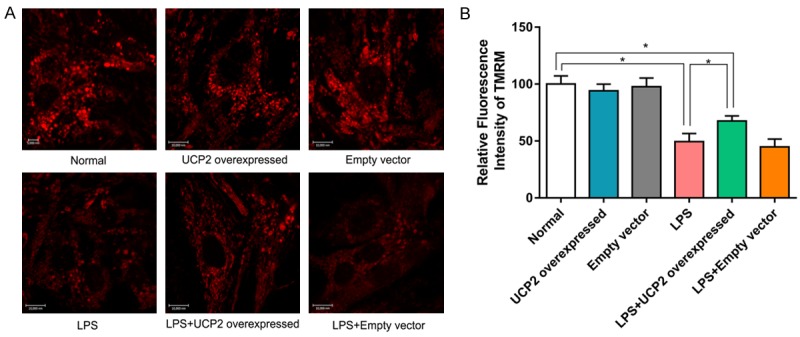
Figure 6.

Cardiomyocytes were stained with TMRM and a confocal microscope was used to observe the fluorescence intensity at 561 nm. The contrast in relative fluorescence intensity reflects the magnitude of the mitochondrial membrane potentials of cardiomyocytes from various groups. LPS stimulation causes the mitochondrial membrane potential to decrease significantly, which is reversed by UCP2 overexpression. N=6. *P<0.05.
