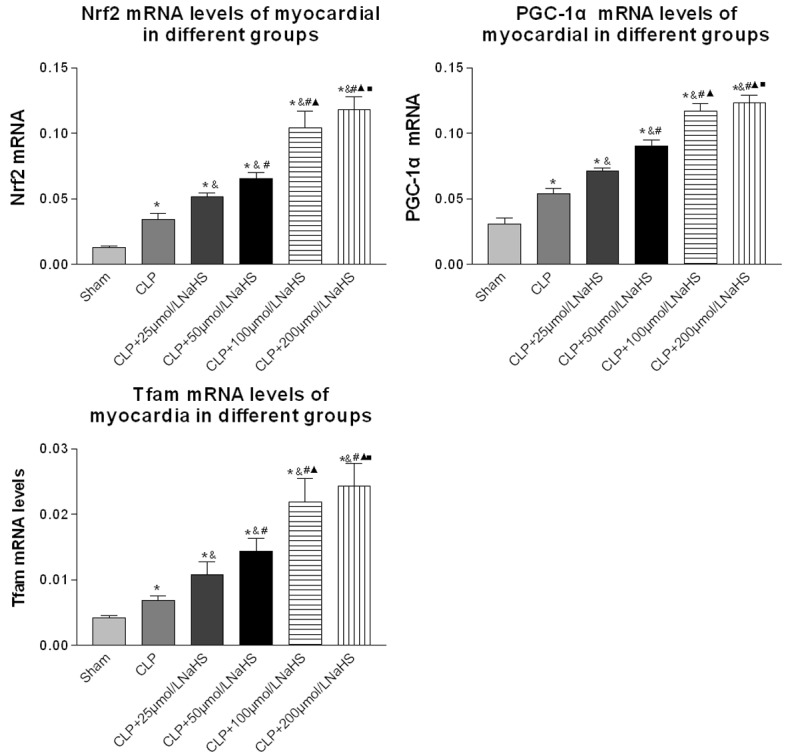
Figure 6.

Comparison of Nrf2, PGC-1α, and Tfam mRNA expression levels of myocardial cells of mice. RNA was isolated using an RNA Isolation Kit. The expression levels of Nrf2, PGC-1α, and Tfam genes were measured using qPCR (n = 10 for each group). Data were presented as the mean ± SD. Statistically significant differences are indicated by *P < 0.01 versus the sham-operated group, &P < 0.01 versus the CLP group, # versus the 25 µmol/L group, ▲ versus the 50 µmol/L group, ■ versus the 100 µmol/L group.
