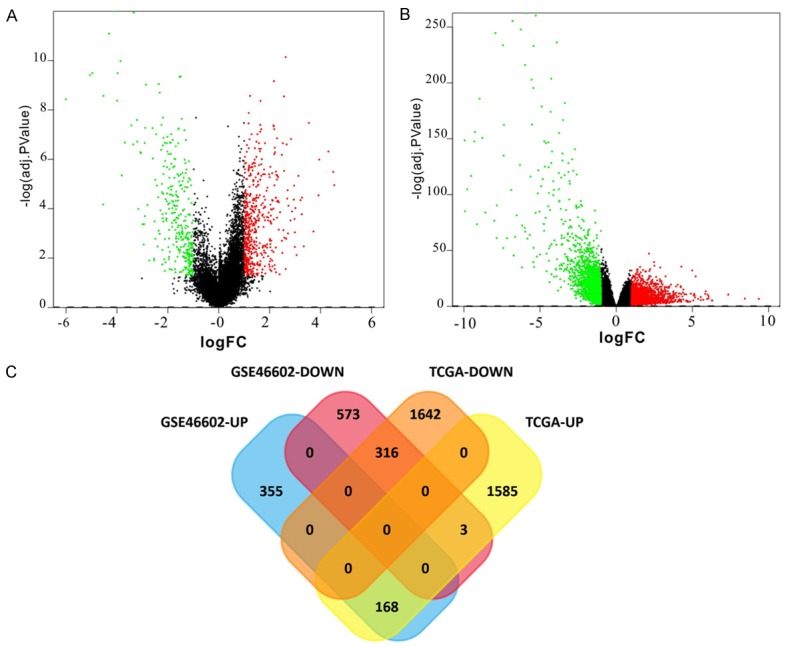
Figure 1.

Two volcano plots of DEGs and one Venn diagram of the DEGs screening. For the volcano, the volcano plot on the left (A) is the result of the GEO database and the volcano plot on the right (B) represents the result of the TCGA database. The abscissa is logFC and the ordinate is -log10 (adj. P Value). The red and green spots represent DEGs. The black dots represent genes that are not differentially expressed between PC and control samples. Red: upregulated; green: downregulated. The Venn diagram (C) indicates the number of DEGs in four different datasets and the crossing area indicates the cross-DEGs in different datasets. 168 upregulated and 316 downregulated genes were identified from the data obtained from the TCGA and GEO databases. GEO, Gene Expression Omnibus; TCGA, The Cancer Genome Atlas; PC, prostate cancer; DEG, differentially expressed gene.
