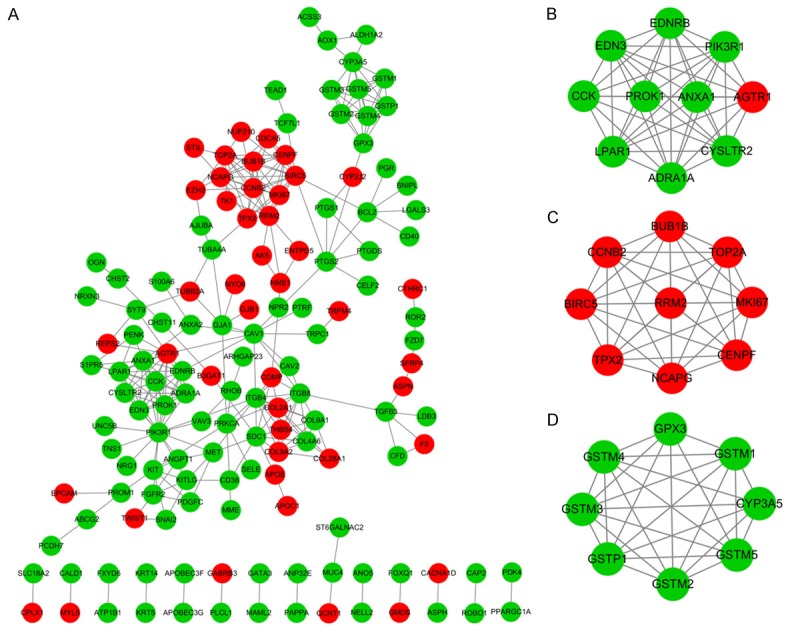
Figure 3.

PPI network of the DEGs and modular analysis. (A) DEG PPI network complex, (B) module 1 of DEGs from PPI network, (C) module 2 of DEGs from PPI network and (D) module 3 of DEGs from PPI network. Red nodes represent the upregulated DEGs and green nodes represent the downregulated DEGs. Increased node interaction suggests a greater biological significance. PPI, protein-protein interaction; DEG, differentially expressed gene.
