
Figure 5.
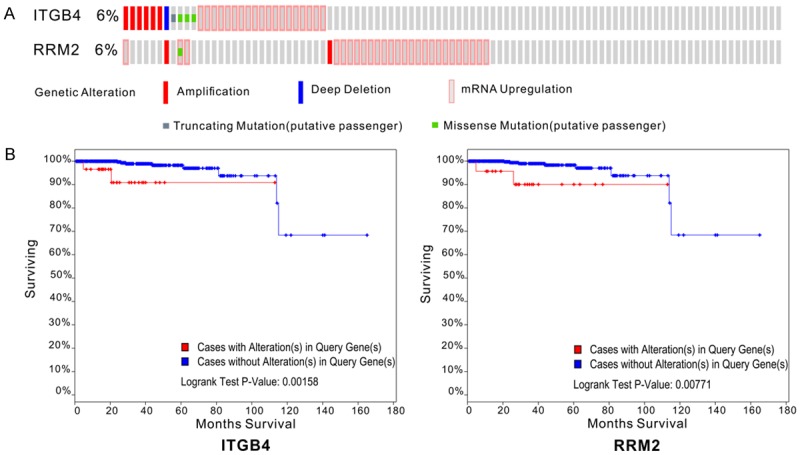
Genetic alterations and the prognostic value of differentially expressed genes in prostate cancer. A. Genetic alterations: Red represents amplification, blue represents deep deletion, pink represents mRNA upregulation, gray represents truncating mutation (putative passenger) and green represents missense mutation (putative passenger). B. Kaplan-Meier curves of two hub genes between group with alterations and group without alterations. The Kaplan-Meier survival curves showed the significant prognostic value of ITGB4 and RRM2 alteration regarding survival. Red line represents cases with alterations in query genes. Blue line represents cases without alterations in query genes. The x-axis indicates overall survival time (months) and the y-axis represents the survival rate. These curves were downloaded from cBioPortal.