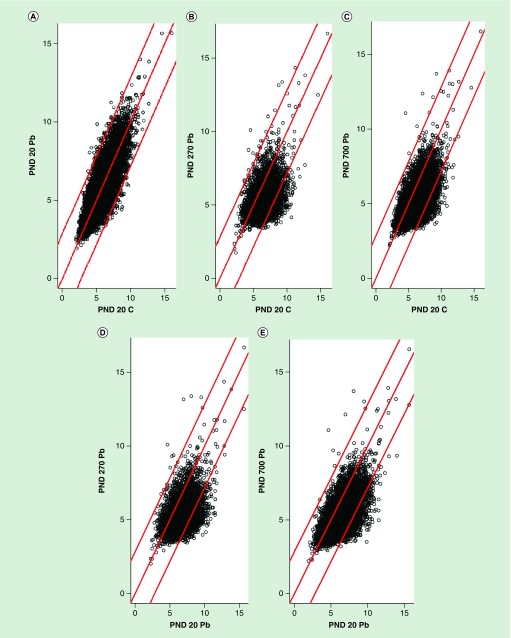
Figure 3. . Differential histone acetylation.
Scatterplots display raw number of acetylation sites between the samples. The red basal line indicates where the values are equal between samples. (A) PND 20 control against PND 20 Pb exposed animals. (B) PND 20 control against PND 270 Pb exposed animals. (C) PND 20 control against PND 700 Pb exposed animals. (D) PND 20 Pb exposed against PND 270 Pb exposed animals. (E) PND 20 Pb exposed against PND 700 Pb exposed animals.
Pb: Lead; PND: Postnatal day.

