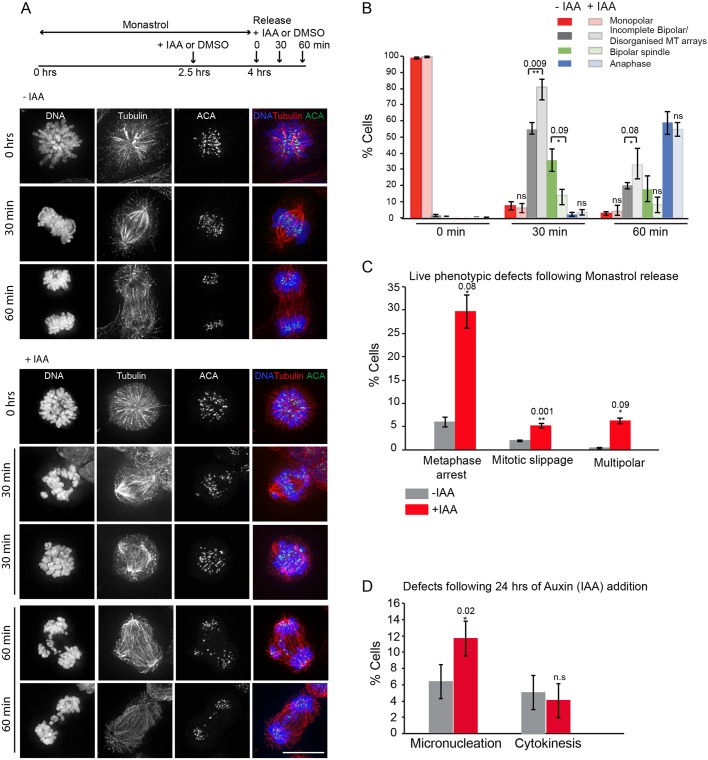
Fig. 3.
Seh1 plays a role in mitotic progression. (A) Schematic diagram of Seh1–mAIDmC cell line synchronisation with Eg5 inhibitor Monastrol prior to IAA addition or not. The drug was washed out with fresh medium prior to release in medium with or without IAA. Cells were fixed at the indicated time points and immunostained with anti-tubulin (red) and -ACA antibodies (green) and for DNA (blue). (B) Quantification of spindle and chromosome alignment in mock (−IAA) and Seh1-depleted (+IAA) cells at the indicated time points after Monastrol release. n=400 (−IAA) and n=400 (+IAA) cells. (C) Quantification of mitotic defects in mock (−IAA) (grey bars) and Seh1-depleted (+IAA) cells (red bars) from live-cell videos following Monastrol release. n=280 (−IAA) and n=295 (+IAA) cells. (D) Quantification of micronucleation and cytokinesis defects in mock (−IAA) (grey bars) and Seh1-depleted (+IAA) cells (red bars) following addition of IAA for 24 h. n=300 (−IAA) and n=300 (+IAA) cells. Results in all panels are from three independent experiments. *P<0.05; **P<0.01; ns, not significant (two-tailed, unpaired t-test). Error bars represent s.d. Scale bar: 10 µm.

