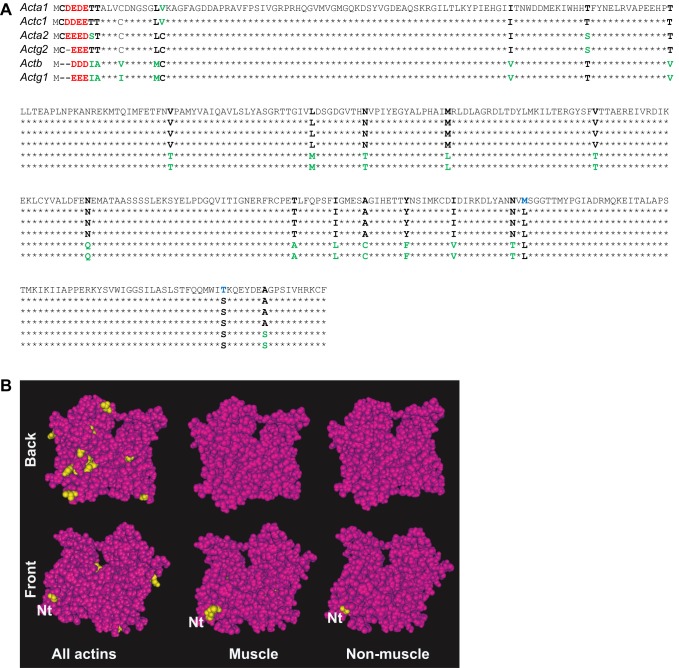
Fig. 1.
Structural comparison of mouse actin isoforms. (A) Primary sequence alignment of mouse actins. Internal residue differences are shown in bold; blue indicates substitutions unique to one isoform, green for those found in two or three isoforms and black for the residues found in the majority of the isoforms. Differences in N-terminal residues are denoted in red. See Table 1 for the protein names that correspond to the gene symbols listed on the top left. (B) Structural maps of the actin isoforms. Top and bottom rows show the ‘front’ and ‘back’ views of the same molecule, with the positions containing different residues in different isoforms denoted in yellow over the maroon color for the residues identical in all the compared isoforms. Nt, N-terminus (shown partially due to the lack of structural data in this region). Images were prepared using Cn3D macromolecular structure viewer (NIH), based on the structure of cardiac α-actin (PDB identifier 1J6Z).

