Fig. 2.
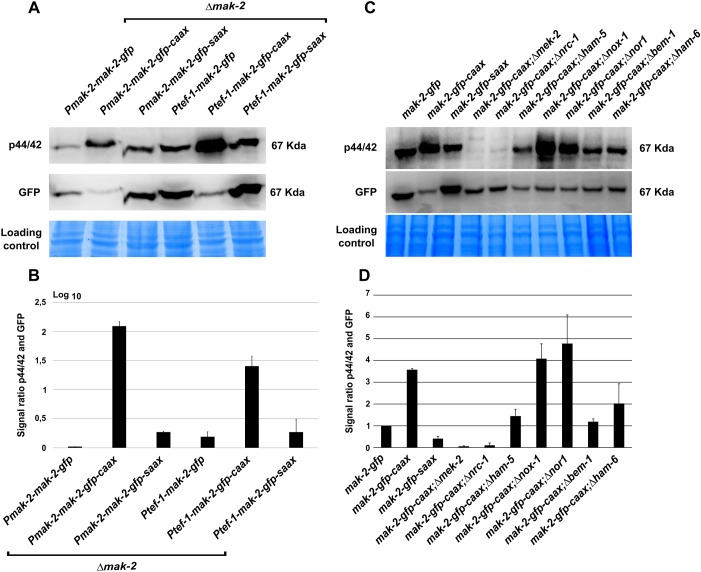
Membrane tethering results in increased phosphorylation of MAK-2 (A) Phospho-western blot analysis. The order of the lanes are: strain P611-3 (mak-2::hph; his3::Pmak-2–mak-2–gfp), strain 642 (mak-2::hph; his3::Pmak-2–mak-2–gfp–caax), strain 404 (mak-2::hph; his3::Pmak-2–mak-2–gfp–saax), strain 633 (mak-2::hph; his3::Ptef-1–mak-2–gfp), strain 640 (mak-2::hph; his3::Ptef-1–mak-2–gfp–caax) and strain 381 (mak-2::hph; his3::Ptef-1–mak-2–gfp–saax). (B) Analyses of the ratio between the phosphorylation and GFP signals for every lane. Results are means±s.d. (n=3). (C) Western blot analysis detecting MAK-2 phosphorylation and GFP of the following strains: 665 (his3::Ptef-1–mak-2–gfp), 267 (his3::Ptef-1–mak-2–gfp–caax), 361 (his3::Ptef-1–mak-2–gfp–saax), 384 (mek-2::hph;his3::Ptef-1–mak-2–gfp–caax), 670 (nrc-1::hph;his3::Ptef-1–mak-2–gfp–caax), 770 (ham-5::hph;his3::Ptef-1–mak-2–gfp–caax), 723 (nox-1::hph;his3::Ptef-1–mak-2–gfp–caax), 719 (nor-1::hph,his3::Ptef-1–mak-2–gfp–caax), 569 (bem-1::hph;his3::Ptef-1–mak-2–gfp–caax) and 773 (ham-6::hph;his3::Ptef-1–mak-2–gfp–caax). (D) Quantification of the ratio between the phosphorylation signal and GFP signal. Results are means±s.d. (n=3).

