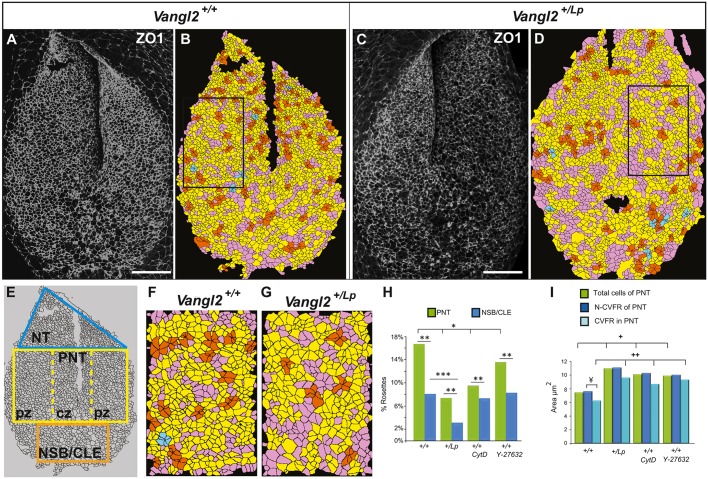
Fig. 5.
Altered apical cell constriction and cell reorganisation into rosettes at the PNP of Vangl2+/Lp, Vangl2Lp/Lp, CytD- and Y-27632-treated embryos. (A-D) Dorsal views of the PNP of E9.5 Vangl2+/+ (A,B) and Vangl2+/Lp (C,D) embryos. (A,C) ZO1 immunolabelling. (B,D) Confocal images segmented with Seedwater Segmenter, and imported to ImageJ to define the rosettes. Cells were colour-coded based on the number of cells that meet at shared vertices: orange, 5-cell rosette; blue, 6-cell rosette. Cells that shared vertices with 4 or 3 cells are in yellow and pink, respectively (not considered rosettes). (E) Diagram illustrating the regionalisation of the PNP: NT, neural tube; PNT, preneural tube; pz, peripheral zones; cz, central zone; NSB/CLE, the node-streak border and the caudal lateral epiblast. (F,G) Magnifications of the PZ (outlined in B and D, respectively). (H) Percentage of cells in rosettes in the PNT and in the NSB/CLE under the four different conditions. (I) Mean apical cell area (μm2) in the PNT, differentiating between: total cell population; cells not forming rosettes (N-CVFR); cells with a vertex forming rosettes (CVFR) in the four different conditions. Symbols all indicate significant differences (P<0.05) between specific cell populations as indicated by the brackets. Scale bars: 50 µm.

