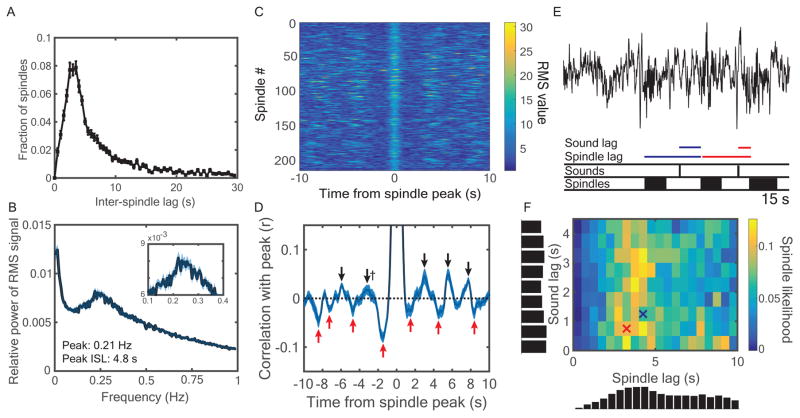
Figure 3.
Characterizing the spindle refractory period. (A) Inter-spindle lags (ISLs) were calculated as the time between the start of successive spindles, shown for up to 30 s. (B) Fast Fourier transformations of the sigma RMS signal revealed cyclic activity most prominent in the 0.17 – 0.33 Hz range, corresponding to ISLs in the range of 3 – 5.9 s. (C) RMS values spanning from −10 s to +10 s surrounding spindle peaks from one sample subject. (D) Correlations between the RMS value of the spindle peak and all other values from −10 to 10 s were calculated for each subject. The correlation was r = 1.0 at the t = 0 spindle peak. All positive (black) and negative (red) peaks that significantly differed from zero across subjects (p < 0.05) are marked with arrows, except † indicates p = 0.07. Brackets indicate approximately symmetric peaks across t = 0. See also Table S2. (E) For each instant along the recording, we found whether a spindle started or not and the time lags since the last spindle and last sound cue. (F) Likelihoods of spindles starting as a joint function of spindle and sound lag. Vertical and horizontal histograms indicate cumulative spindle likelihood within each row and column, respectively. Crosses indicate bins corresponding to color-coded time lags from (E). See also Figure S2.

