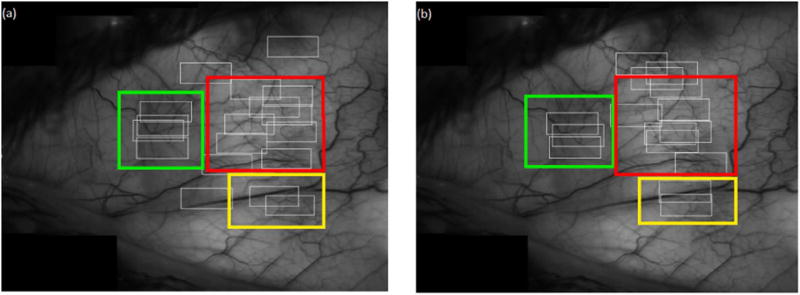
Fig. 1.
Example of a conjunctival microvasculature mosaic image in an NC subject showing regions of image sequences (white boxes) for (a) the first and (b) the second visits. Overlapping regions between the 2 visits are shown by similarly colored boxes overlaid on the mosaic image. (For interpretation of the references to color in this figure legend, the reader is referred to the web version of this article.)

