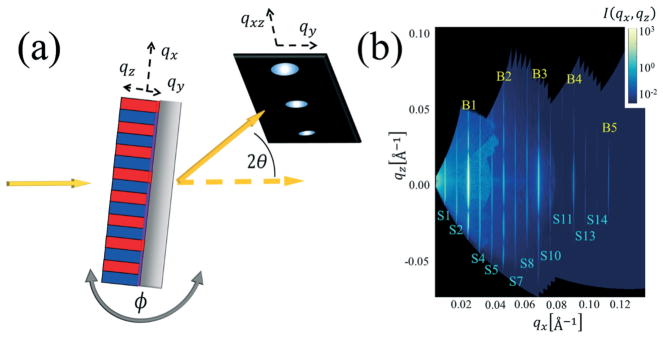
Fig. 1.
(a) Schematic of the experimental setup for res-CDSAXS experiment. Reciprocal space axes are shown. (b) Example 2D reciprocal space map of the intensity I(qx, qz) used to extract the peak slices along qx direction for inversely fitting the structure profile. Peak slice types are labeled as yellow Bn for Bragg peaks (that contain more information about the BCP periodic structure) and Sn for satellite peaks (that contain more information about the DSA template structure).

