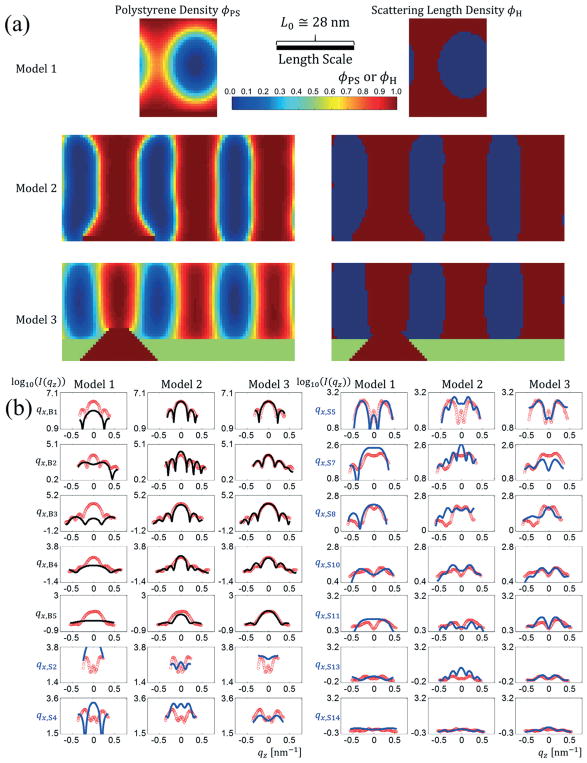
Fig. 3.
(a) Resulting PS SCFT density profiles (left) and scattering length density profiles (right) for the best fits found to a set of experimental BCP DSA data with a template period to BCP period ratio of 3 to 1. Model 1 (top) uses no guiding stripe and lets the surface energies vary freely (corresponds to only a single repeating lamellae feature). Model 2 (middle) uses a flat guiding stripe with no height difference in the guiding stripe and brush regions. Model 3 (bottom) uses a trapezoidal shape profile to model the guiding stripe region (crimson red) and the brush region (green). (b) Best fit scattered intensity profiles for the three different template models for 14 different qx slice values with Bragg peak slices in black and satellite peak slices in blue plotted over the experimental data (red circles) against qz. The left column contains the Bragg peak slices and first two satellite peak slices and the right column the last seven satellite peak slices. In each column from left to right are fits using template model 1, model 2, and model 3. The length scale bar is for both horizontal and vertical directions (i.e., the aspect ratio as shown is unity).

