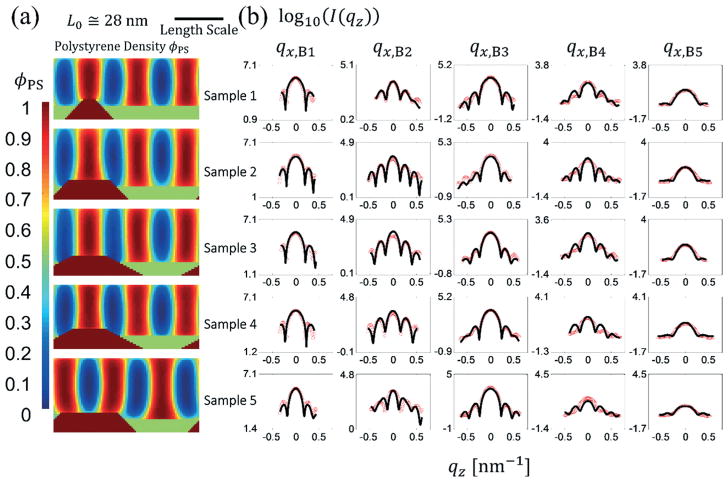
Fig. 4.
(a) From top to bottom, the PS densities from SCFT simulations are shown for the best fit solutions from a different sample with an expected increasing guide stripe width. (b) Intensity profiles for the five samples whose structure profile solutions are shown in (a) where the red circles are the experimental data and the black lines are the Bragg peak slice fits. The satellite peak slice fits are presented in the ESI.‡ The length scale bar is for both horizontal and vertical directions (i.e., the aspect ratio as shown is unity).

