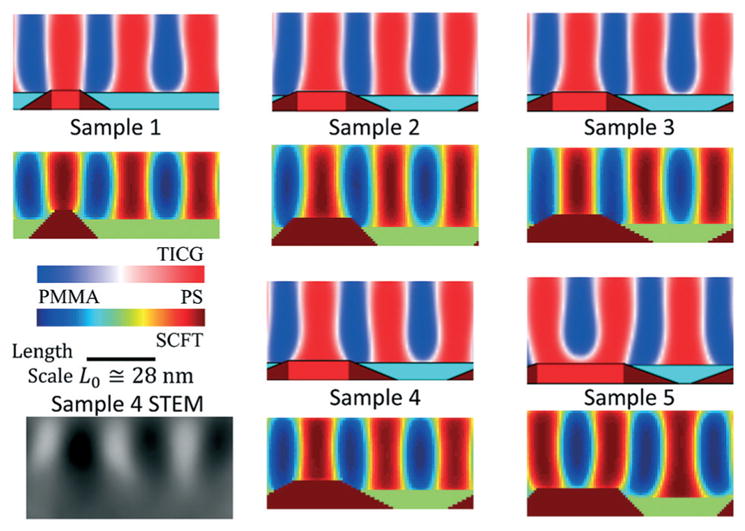
Fig. 5.

Comparison of the best structure profiles from the TICG model in the previous study with the SCFT model in the present study. The TICG structures are on top and the SCFT structures on the bottom for each labeled sample. Color maps used for the density values going from 100% PS in red to 100% PMMA in blue are shown inset for each model with the TICG going from shades of red to white to blue and the SCFT using a color map that goes from red to orange to yellow to green to cyan to blue. Inset in the lower left corner is a STEM cross-sectional image where the dark regions are PS and the light regions are PMMA. The length scale bar is for both horizontal and vertical directions (i.e., the aspect ratio as shown is unity).
