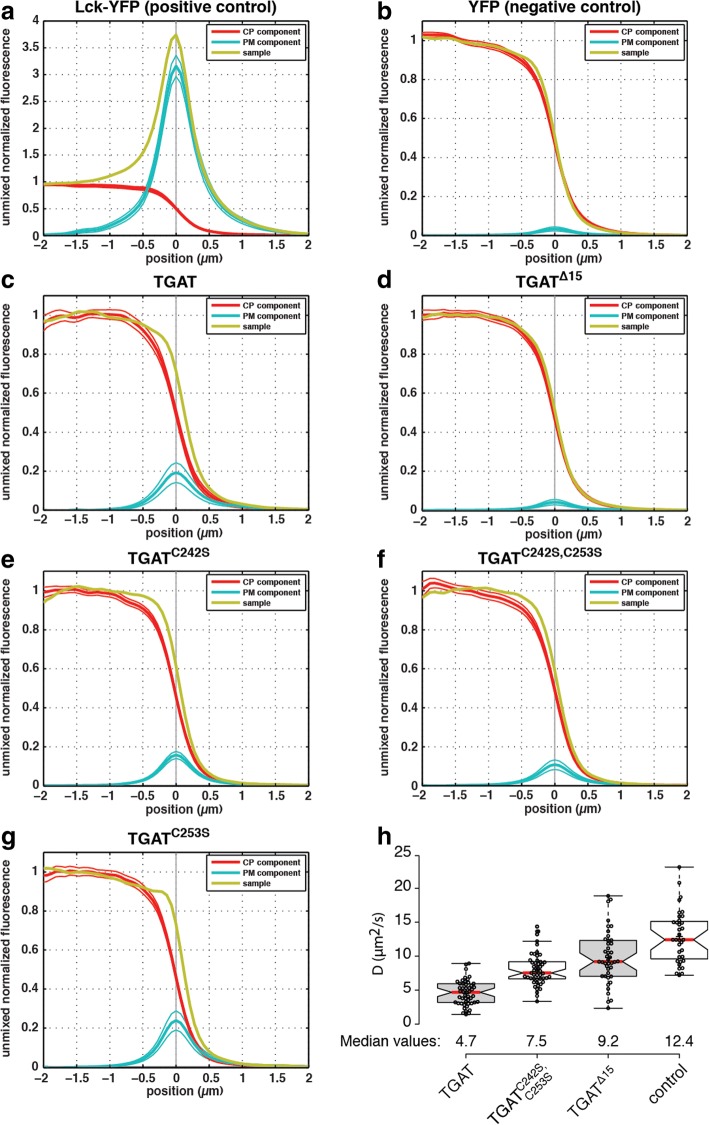
Fig. 3.
Determination of plasma membrane localization of all TGAT variants. Confocal microscopy was performed on HeLa cells transfected with a plasma membrane marker (Lck-CFP), a cytoplasm marker (soluble RFP) and either (a) Lck-YFP (n = 67 lines, 10 cells), (b) YFP (n = 66 lines, 12 cells), (c) YFP-TGAT (n = 88 lines, 30 cells), (d) YFP-TGATΔ15 (n = 130 lines, 19 cells), (e) YFP-TGATC242S (n = 129 lines, 12 cells), (f) YFP-TGATC242S, C253S (n = 112 lines, 12 cells) or (g) YFP-TGATC253S (n = 79 lines, 5 cells). Averaged line profiles were obtained using a Matlab script and ImageJ, the profiles were normalized to cytoplasmic levels. Line profiles for the YFP channel (yellow) were subsequently unmixed in order to obtain the plasma membrane (blue) and cytoplasmic (red) component in each construct of interest. The solid thin lines above and below the PM and CP profiles represent the 95% confidence interval obtained from statistical bootstrapping. See Material and Methods for more details. h Diffusion coefficients of different TGAT mutants, as determined by fluctuation correlation spectroscopy (FCS). Diffusion coefficients were determined for HeLa cells transfected with CFP-TGAT (n = 49), CFP-TGATC242S, C253S (n = 49), CFP-TGATΔ15 (n = 42) or free CFP (control, n = 35). Boxplot center lines represent the median values (red); box limits indicate the 25th and 75th percentiles as determined by R software; whiskers extend 1.5 times the interquartile range from the 25th and 75th percentiles; data points from individual cells are plotted as dots

