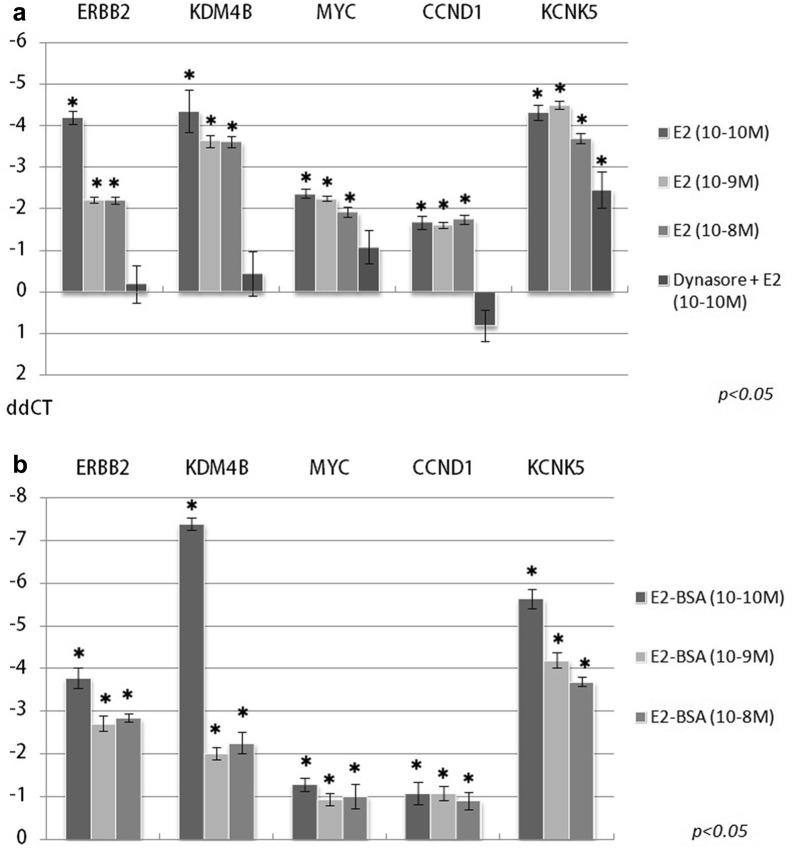
Fig. 1.
Gene expression changes after treatment of MCF-7 cells with 17β-estradiol and estrogen–BSA. Expression changes of CCND1, ERBB2, KCNK5, KDM4B, and MYC after 17-β-estradiol (E2) (a) and estrogen–BSA treatment (b). Treatments were performed in three different concentrations (10−10 M, 10−9 M, 10−8 M) and a similar E2 treatment (10−10 M) on dynamin inhibitor (dynasore, 30 min) pretreated cells. Y-axis represents ddCT values, 0 line indicates control level. (Error bars represent standard deviation, asterisks indicate significant changes compared to control with p value < 0.05). Numerical ddCT values are shown in Additional file 1: Table Sheet 5

