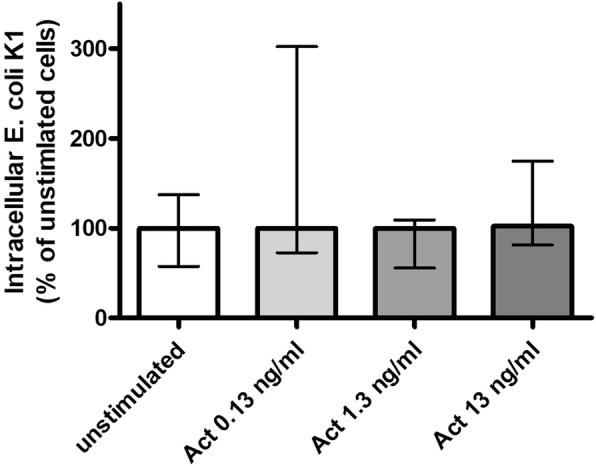
Fig. 1.

Phagocytosis of E. coli by microglial cells treated with activin A alone. Comparison of E. coli K1 phagocytosis between unstimulated microglial cells and microglial cells treated with activin A in concentrations of 0.13, 1.3, and 13 ng/ml (n = 11–30 from up to seven experiments). In each experiment, the mean number of bacteria ingested by unstimulated control cells was defined as 100%. Phagocytic rates of the stimulated groups are presented as percentages of phagocytosis of the unstimulated control group (medians with interquartile ranges). Data were analyzed by Kruskal-Wallis test followed by Dunn’s multiple comparison test
