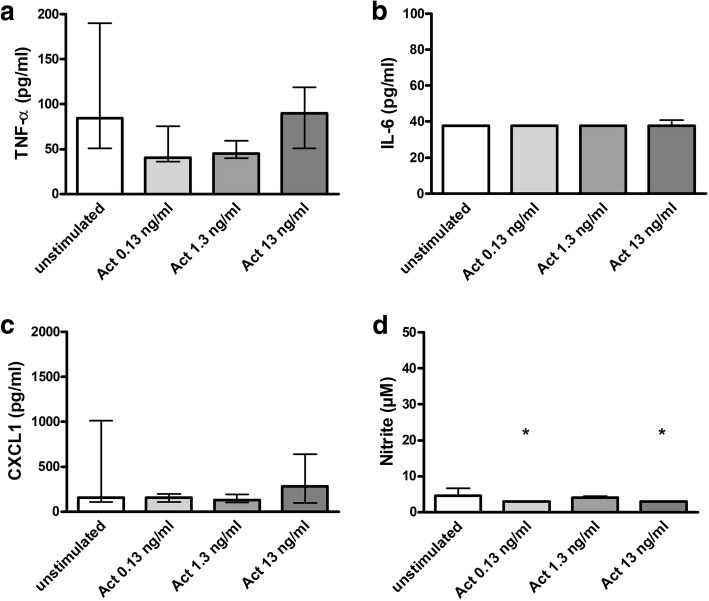
Fig. 3.
Release of proinflammatory cytokines and NO by microglial cells treated with activin A alone. Comparison of concentrations of TNF-α (pg/ml) (a), IL-6 (pg/ml) (b), CXCL1 (pg/ml) (c), and NO (μM) (d) in the supernatants of unstimulated primary murine microglial cells and microglial cells treated with activin A in concentrations of 0.13, 1.3, and 13 ng/ml [a: n = 8–27 from up to six experiments; b, c: n = 8–18 from up to four experiments; d: n = 3 from one single experiment / b: almost all values were below the detection limit of 38 pg/ml IL-6; d: for activin A 0.13 and 13 ng/ml, all values were below the detection limit of 3 μM nitrite]. Data are presented as medians with interquartile ranges and were analyzed by Kruskal-Wallis test followed by Dunn’s multiple comparison test (*p < 0.05)

