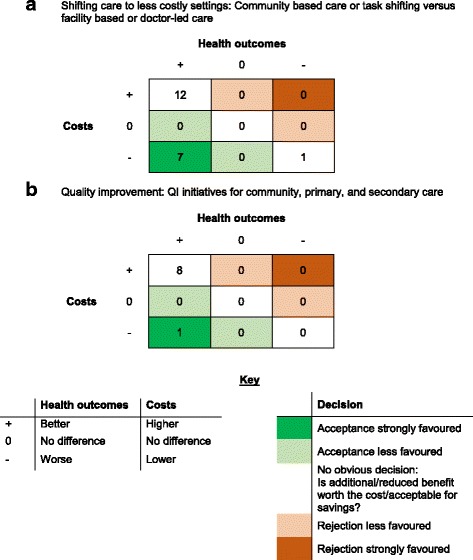
Fig. 2.

Permutation plots summarising the number of economic evaluations according to their findings. Numbers in cells represent numbers of studies. a Shifting care to less costly settings: Community based care or task shifting versus facility based or doctor-led care. b Quality improvement: QI initiatives for community, primary, and secondary care
