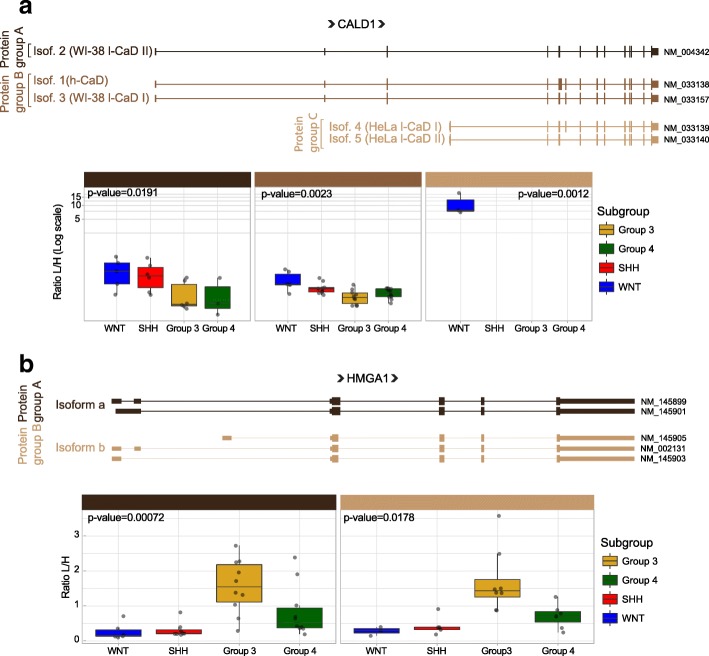
Fig. 5.
CALD1 and HMGA1 isoforms in medulloblastoma tumors. Schematic representation of CALD1 (a) and HMGA1 (b) isoforms. The boxplots show the quantification of each protein isoform group across all medulloblastoma subgroups. p-values for differences between subgroups were calculated based on the Kruskal-Wallis rank-sum test. A protein group is defined as the group of isoforms that are indistinguishable due to the position of identified peptides

