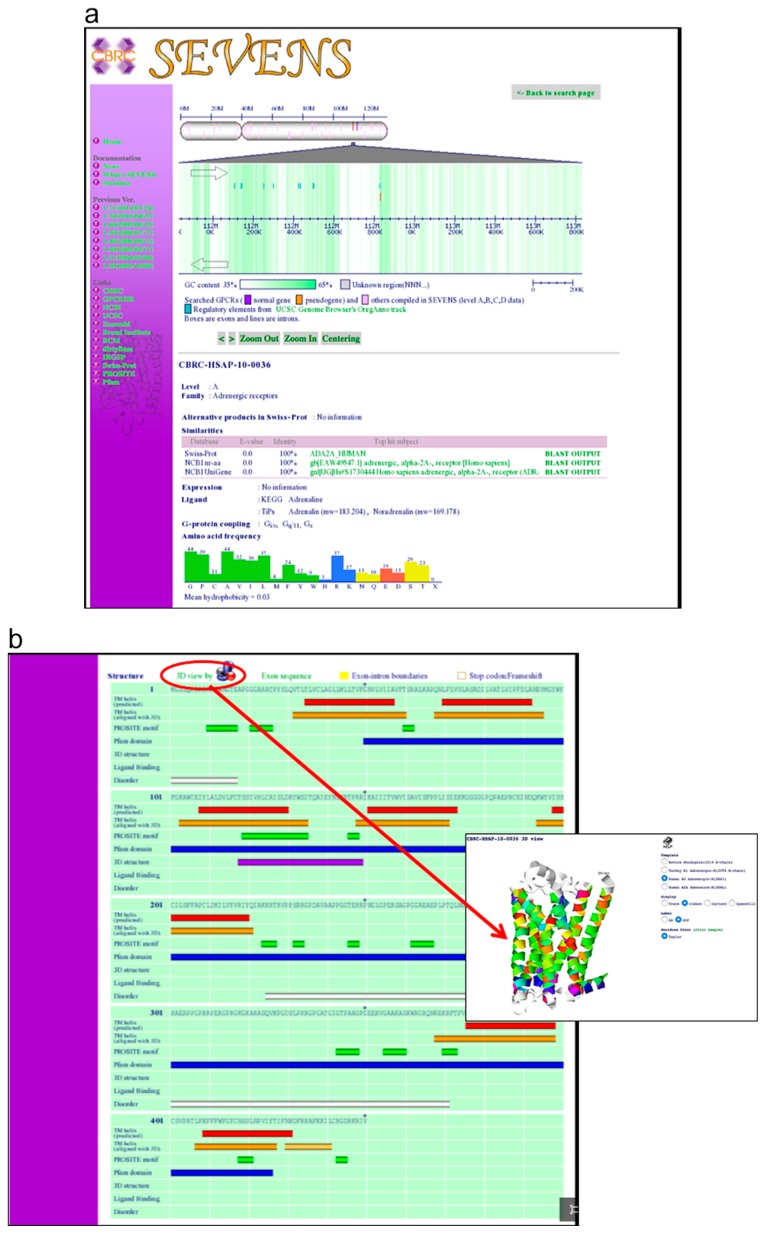
Figure 2.
a. Chromosomal coordinate information, together with the known information on regulatory regions (green bars). The board color represents the GC content of the genome sequence. The selected gene is colored red. In a table in the lower region of this figure, the information of the selected protein sequences (sequence search result against the Swiss-Prot/TrEMBL, nr.aa, and UniGene database using BLAST) is shown. Furthermore, information such as the gene expression pattern, binding ligand, the type of binding G-protein, and the composition of the amino acid sequence, are described in the bottom region. b. Structural information, such as predicted TM helix region (red bar) by SOSUI, PROSITE motif pattern regions (green bar), domain regions (blue bar), predicted disorder regions by DISOPRED (white bar), exon-intron boundary, pseudogene, novel genes, and regions of known structure (purple bar), can be observed. Each exon sequence appears when “EXON SEQUENCES” is clicked. The structures for class A GPCRs, determined by comparative modeling, are presented in Jmol 3D viewer. Based on these structures, the actual TM helix regions are displayed (yellow bar) on the structure board.

